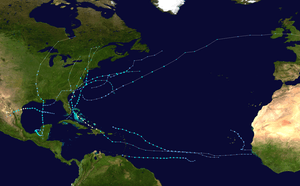
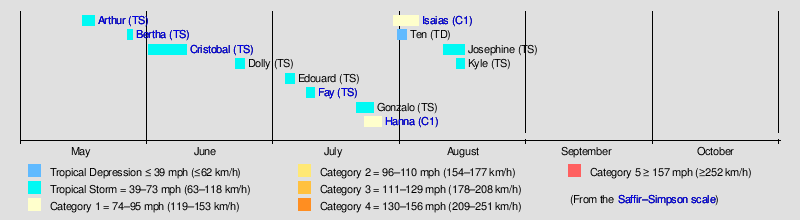
2020 Atlantic hurricane season
The 2020 Atlantic hurricane season is the first hurricane season on record in which nine tropical storms formed before August 1. It is an ongoing event in the annual cycle of tropical cyclone formation. During the season, a total of 12 tropical depressions, eleven tropical storms, and two hurricanes developed. The season officially started on June 1 and will officially end on November 30; however, the formation of tropical cyclones is possible at any time, as illustrated by the formations of tropical storms Arthur and Bertha, on May 16 and 27, respectively, marking the sixth consecutive year with pre-season systems. Earlier than normal activity continued into June, with Tropical Storm Cristobal becoming the earliest third named storm on record when it formed on June 2. In July, tropical storms Edouard, Fay, Gonzalo, Hanna, and Isaias became the earliest fifth, sixth, seventh, eighth, and ninth named storms, forming on July 4, 9, 21, 23, and 30 respectively. The trend continued in August, with tropical storms Josephine and Kyle becoming the earliest tenth and eleventh named storms, forming on August 13 and 14, respectively.
| 2020 Atlantic hurricane season | |
|---|---|
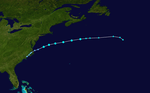
 Season summary map | |
| Seasonal boundaries | |
| First system formed | May 16, 2020 |
| Last system dissipated | Season ongoing |
| Strongest storm | |
| Name | Hanna |
| • Maximum winds | 90 mph (150 km/h) (1-minute sustained) |
| • Lowest pressure | 973 mbar (hPa; 28.73 inHg) |
| Seasonal statistics | |
| Total depressions | 12 |
| Total storms | 11 |
| Hurricanes | 2 |
| Major hurricanes (Cat. 3+) | 0 |
| Total fatalities | 45 total |
| Total damage | > $5.96 billion (2020 USD) |
| Related articles | |
In late May, Bertha caused over $200 million (2020 USD) in damage and one fatality when it made landfall on and crossed the East Coast of the United States. A week later in June, Cristobal caused 15 deaths and $675 million in damage across Mexico, Guatemala, and the United States. In July, Fay brought tropical storm force winds across Delaware, New Jersey, and coastal New York, resulting in $400 million in damage and six deaths. Gonzalo brought minor impacts to southern parts of the Lesser Antilles. Hanna, the season's first hurricane, made landfall in South Texas as a Category 1 hurricane, leaving at least $500 million in damage. Isaias, the second hurricane of the season, brought impacts to much of the Eastern Caribbean and Florida, made landfall in North Carolina at its peak intensity as a strong Category 1 hurricane, and brought widespread power outages and a destructive tornado outbreak to the Eastern United States, overall causing $4.2 billion in damage.
Due to the ongoing COVID-19 pandemic, officials in the United States have expressed concerns about the hurricane season potentially exacerbating the effects of the pandemic.[1][2] Evacuations would be significantly hindered due to fears of contracting the virus, and the worry that social distancing rules would break down when giving aid to hurricane-affected areas. As Hurricane Hanna approached landfall, local officials underscored the reality of the coronavirus when warning residents living in flood-prone neighborhoods about the prospect of evacuation.[3]
Seasonal forecasts
| Source | Date | Named storms |
Hurricanes | Major hurricanes |
Ref |
| Average (1981–2010) | 12.1 | 6.4 | 2.7 | [4] | |
| Record high activity | 28 | 15 | 7 | [5] | |
| Record low activity | 4 | 2† | 0† | [5] | |
| ––––––––––––––––––––––––––––––––––––––––––––––––––––––– | |||||
| TSR | December 19, 2019 | 15 | 7 | 4 | [6] |
| CSU | April 2, 2020 | 16 | 8 | 4 | [7] |
| TSR | April 7, 2020 | 16 | 8 | 3 | [8] |
| UA | April 13, 2020 | 19 | 10 | 5 | [9] |
| TWC | April 15, 2020 | 18 | 9 | 4 | [10] |
| NCSU | April 17, 2020 | 18–22 | 8–11 | 3–5 | [11] |
| SMN | May 20, 2020 | 15–19 | 7–9 | 3–4 | [12] |
| UKMO* | May 20, 2020 | 13* | 7* | 3* | [13] |
| NOAA | May 21, 2020 | 13–19 | 6–10 | 3–6 | [14] |
| ACCU | May 25, 2020 | 14–20 | 7-11 | 4–6 | [15] |
| TSR | May 28, 2020 | 17 | 8 | 3 | [16] |
| CSU | June 4, 2020 | 19 | 9 | 4 | [17] |
| UA | June 12, 2020 | 17 | 11 | 4 | [18] |
| CSU | July 7, 2020 | 20 | 9 | 4 | [19] |
| TSR | July 7, 2020 | 18 | 8 | 4 | [20] |
| TWC | July 16, 2020 | 20 | 8 | 4 | [21] |
| ACCU | July 30, 2020 | 20-24 | 9-11 | 4–6 | [22] |
| CSU | August 5, 2020 | 24 | 12 | 5 | [23] |
| TSR | August 5, 2020 | 24 | 10 | 4 | [24] |
| NOAA | August 6, 2020 | 19–25 | 7–11 | 3–6 | [25] |
| ––––––––––––––––––––––––––––––––––––––––––––––––––––––– | |||||
| Actual activity |
11 | 2 | 0 | ||
| * June–November only † Most recent of several such occurrences. (See all) | |||||
Forecasts of hurricane activity are issued before each hurricane season by noted hurricane experts such as Philip J. Klotzbach and his associates at Colorado State University; and separately by NOAA forecasters.
Klotzbach's team (formerly led by William M. Gray) defined the average (1981 to 2010) hurricane season as featuring 12.1 tropical storms, 6.4 hurricanes, 2.7 major hurricanes (storms reaching at least Category 3 strength in the Saffir–Simpson hurricane scale), and an accumulated cyclone energy (ACE) index of 106 units.[7] NOAA defines a season as above normal, near normal or below normal by a combination of the number of named storms, the number reaching hurricane strength, the number reaching major hurricane strength, and the ACE Index.[26]
Pre-season forecasts
On December 19, 2019, Tropical Storm Risk (TSR), a public consortium consisting of experts on insurance, risk management, and seasonal climate forecasting at University College London, issued an extended-range forecast predicting a slightly above-average hurricane season. In its report, the organization called for 15 named storms, 7 hurricanes, 4 major hurricanes, and an ACE index of 105 units. This forecast was based on the prediction of near-average trade winds and slightly warmer than normal sea surface temperatures (SSTs) across the tropical Atlantic as well as a neutral El Niño–Southern Oscillation (ENSO) phase in the equatorial Pacific.[6] On April 2, 2020, forecasters at Colorado State University echoed predictions of an above-average season, forecasting 16 named storms, 8 hurricanes, 4 major hurricanes, and an ACE index of 150 units. The organization posted significantly heightened probabilities for hurricanes tracking through the Caribbean and hurricanes striking the U.S. coastline.[7] TSR updated their forecast on April 7, predicting 16 named storms, 8 hurricanes, 3 major hurricanes, and an ACE index of 130 units.[8] On April 13, the University of Arizona (UA) predicted a potentially hyperactive hurricane season: 19 named storms, 10 hurricanes, 5 major hurricanes, and accumulated cyclone energy index of 163 units.[9] A similar prediction of 18 named storms, 9 hurricanes, and 4 major hurricanes was released by The Weather Company on April 15.[10] Following that, the North Carolina State University released a similar forecast on April 17, also calling for a possibly hyperactive season with 18–22 named storms, 8–11 hurricanes and 3–5 major hurricanes.[11]
On May 20, Mexico's Servicio Meteorológico Nacional released their forecast for an above-average season with 15–19 named storms, 7–9 hurricanes and 3–4 major hurricanes.[12] The UK Met Office released their outlook that same day, predicting average activity with 13 tropical storms, 7 hurricanes, and 3 major hurricanes expected to develop between June and November 2020. They also predicted an ACE index of around 110 units.[13] NOAA issued their forecast on May 21, calling for a 60% chance of an above-normal season with 13–19 named storms, 6–10 hurricanes, 3–6 major hurricanes, and an ACE index between 110% and 190% of the median. They cited the ongoing warm phase of the Atlantic multidecadal oscillation and the expectation of continued ENSO-neutral or even La Niña conditions during the peak of the season as factors that would increase activity.[14]
Mid-season forecasts
On June 4, Colorado State University released an updated forecast, calling for 19 named storms, 9 hurricanes, and 4 major hurricanes.[17] On July 7, Colorado State University released an updated forecast, calling for 20 named storms, 9 hurricanes, and 4 major hurricanes.[19] On July 7, Tropical Storm Risk released an updated forecast, calling for 18 named storms, 8 hurricanes, and 4 major hurricanes.[20] On July 16, The Weather Company released an updated forecast, calling for 20 named storms, 8 hurricanes, and 4 major hurricanes.[21] On August 5, Colorado State University released an updated forecast, their final for 2020, calling for a near-record-breaking season, predicting a total of 24 named storms, 12 hurricanes, and 5 major hurricanes, citing the anomalously low wind shear and surface pressures across the basin during the month of July and substantially warmer then average tropical Atlantic and incoming La Niña.[27] On August 5, Tropical Storm Risk released an updated forecast, their final for 2020, also calling for a near-record-breaking season, predicting a total of 24 named storms, 10 hurricanes, and 4 major hurricanes, citing the favourable July trade winds, low wind shear, warmer than average tropical Atlantic and the incoming La Niña.[28] The following day, NOAA released their second forecast for the season whilst calling for an "extremely active" season containing 19-25 named storms, 7-11 hurricanes, and 3-6 major hurricanes. This was one of the most active forecasts ever released by NOAA for an Atlantic hurricane season.[29]
Seasonal summary
Tropical cyclogenesis began in the month of May, with tropical storms Arthur and Bertha. This was the first occurrence of two pre-season tropical storms in the Atlantic since 2016, and the first occurrence of two named storms in the month of May since 2012. The season's third tropical storm named Cristobal formed on June 1, coinciding with the official start of the Atlantic hurricane season. The following day, when it acquired gale-force winds and its name, it became the earliest occurrence of a third named storm in a season on record. Later, Subtropical Depression Four formed on June 22, transitioning and strengthening to a tropical storm and receiving the name "Dolly" the next day, becoming one of the earliest fourth named storms in a season. On July 4, Tropical Depression Five developed near Bermuda, later intensifying into Tropical Storm Edouard on July 6, Edouard became the earliest fifth named storm of a season on record, surpassing Hurricane Emily in 2005 by five days. On July 9, a mesoscale convective vortex that had been tracked for nearly a week was designated as Tropical Storm Fay, becoming the earliest sixth named storm in a season by 12 days, beating out Tropical Storm Franklin from 2005. On July 21, a tropical wave had sufficient organization to be designated Tropical Depression Seven by the NHC, which later became Tropical Storm Gonzalo, beating Gert from 2005 by two days. An eighth tropical depression formed soon after Gonzalo. The season saw the development of seven tropical storms that failed to reach hurricane status, the first occurrence of such a phenomenon since 2013, as Hanna became the season's first hurricane on July 25, and became the record earliest 8th named storm, beating Harvey from 2005 by ten days. Soon after, Tropical Storm Isaias became the earliest 9th named storm on record in the basin, forming on July 30, beating 2005's Hurricane Irene by 9 days. Isaias went on to become the second hurricane of the season and cause widespread damage in portions of the Caribbean and United States. Tropical Depression Ten also formed in late July off the coast of East Africa, and although not reaching tropical storm status, this exceeded 2005 for the most active July on record in the basin in terms of formed systems.[30]
The accumulated cyclone energy (ACE) index for the 2020 Atlantic hurricane season, as of 21:00 UTC August 16, is 24.4075 units.[nb 1] Broadly speaking, ACE is a measure of the power of a tropical or subtropical storm multiplied by the length of time it existed. It is only calculated for full advisories on specific tropical and subtropical systems reaching or exceeding wind speeds of 39 mph (63 km/h).
Systems
Tropical Storm Arthur
| Tropical storm (SSHWS) | |
  | |
| Duration | May 16 – May 19 |
|---|---|
| Peak intensity | 60 mph (95 km/h) (1-min) 991 mbar (hPa) |
Early on May 14, the NHC began to monitor an area of shower and thunderstorm activity over the Straits of Florida for development.[31] The system moved generally northeast into the region of the Bahamas while steadily organizing, becoming the season's first tropical depression at 21:00 UTC on May 16.[32] A reconnaissance aircraft investigated the system several hours later and found supporting evidence for the NHC to upgrade the depression to Tropical Storm Arthur at 03:00 UTC on May 17.[33] Arthur managed to intensify slightly off the coast of Florida and Georgia. Even though the system was moving through the warmest waters of the Gulf Stream,[34] the satellite appearance began to degrade as it neared the coast of North Carolina, plagued by dry air and moderate wind shear.[35] Nevertheless, Arthur reorganized early on May 18 and strengthened slightly before making a close pass to the Outer Banks.[36] Later that day, the storm moved into an area of higher wind shear, exposing its center of circulation and marking the beginning of its extratropical transition,[37] a process it completed by 15:00 UTC May 19, well east of southern Virginia.[38]
Featuring the formation of a pre-season tropical storm, the 2020 Atlantic hurricane season became the sixth consecutive season with a tropical cyclone before the official June 1 start date.[39] Passing within 20 nautical miles of the Outer Banks, Arthur caused tropical storm force wind gusts and a single report of sustained tropical storm force winds at Alligator River Bridge.[37]
Tropical Storm Bertha
| Tropical storm (SSHWS) | |
  | |
| Duration | May 27 – May 28 |
|---|---|
| Peak intensity | 50 mph (85 km/h) (1-min) 1004 mbar (hPa) |
On May 25, the NHC began to track thunderstorms associated with an elongated surface trough located over Florida and the adjoining Atlantic Ocean for potential development into a tropical cyclone, but did not expect formation due to strong upper-level winds.[40] However, contrary to predictions, the system organized after moving northwards, which in turn was contributed to an increase in convection and winds within the system. Based on NWS Doppler radar data from Charleston and buoy data, the NHC initiated advisories on Tropical Storm Bertha at 12:00 UTC on May 27. The system had an unusually small field of gale-force winds, stretching only 25 miles from the center.[41][42] Bertha continued to strengthen despite its proximity to land, [43] and one hour after the first advisory was issued, Bertha made landfall on the South Carolina coast with winds of 50 mph (80 km/h).[43] The storm began to weaken rapidly once inland, becoming a tropical depression just hours after landfall,[44] and it quickly degenerated to a post-tropical remnant over West Virginia at 09:00 UTC on May 28.[45] Bertha quickly enlarged as it became extratropical, and its remnants caused heavy rainfall and thunderstorms in the Great Lakes region before being absorbed by a larger extratropical system on May 29.
The precursor disturbance to Bertha caused a significant, multi-day rainfall event across South Florida, with accumulations of 8–10 in (200–250 mm) across several locations, and with a maximum 72-hour accumulation of 14.19 in (360 mm) in Miami.[46] The city observed a 24-hour total of 7.4 in (190 mm), more than doubling the previous daily rainfall record.[47] In and around Miami, the rains flooded homes and roadways, especially in close proximity to canals.[48] Some homes even reported partial roof collapses throughout Hallandale Beach and Hollywood as a result of the heavy precipitation.[49] Days of heavy rainfall prompted local National Weather Service offices to issue flash flood warnings, and sporadic severe thunderstorms prompted additional advisories. An EF1 tornado caused primarily tree and fencing damage in southern Miami, though several campers were also overturned.[50] Gusts associated with the disturbance in Florida topped out at 51 mph (82 km/h) near Key Biscayne.[51] Even as the system progressed north away from Florida, the outer fringes of Bertha contributed to stormy weather across the state through May 27. In South Carolina, one death, a drowning, occurred related to rip currents in Myrtle Beach[52][53] and US$200 million in damage were caused by Bertha.[54]
Tropical Storm Cristobal
| Tropical storm (SSHWS) | |
  | |
| Duration | June 1 – June 10 |
|---|---|
| Peak intensity | 60 mph (95 km/h) (1-min) 992 mbar (hPa) |
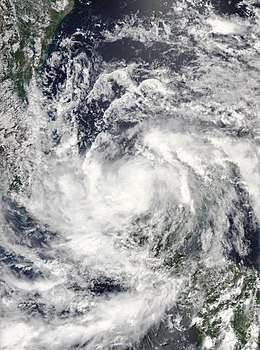
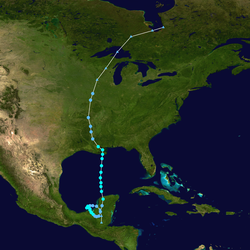
On May 31, the NHC started to note that Tropical Depression Two-E in the Eastern Pacific, later to be known as Tropical Storm Amanda, would have the potential to redevelop in the Bay of Campeche.[55] Amanda would then make landfall in Guatemala, its low-level circulation dissipating by 21:00 UTC that day. Its remnants moved north-northwest to the Bay of Campeche and began to re-develop over the Yucatan Peninsula.[56] At 21:00 UTC on June 1, the remnants of Amanda redeveloped into Tropical Depression Three over the Bay of Campeche. The depression very slowly moved west over the Bay of Campeche and intensified into a tropical storm at 15:15 UTC June 2, and it was named Cristobal.[57][58] This marked the earliest third named storm in the Atlantic, beating the previous record set by Tropical Storm Colin which became a tropical storm on June 5, 2016.[59] Throughout the remainder of the day, Cristobal's windfield became more symmetrical and well defined,[60] and it gradually strengthened with falling barometric pressure as the storm meandered towards the Mexican coastline.[61] Cristobal made landfall as a strong tropical storm just west of Ciudad del Carmen at 13:35 UTC on June 3 at its peak intensity of 60 mph (97 km/h).[62] Cristobal moved very slowly inland, and it weakened back down to tropical depression status as the overall structure of the storm deteriorated while it remained quasi-stationary over southeastern Mexico.[63]
The storm began accelerating northwards on June 5 as an arced band of convection began to develop over the northern and eastern sides of the storm.[64] By 18:00 UTC that day, despite being situated inland over the Yucatan peninsula, Cristobal had reintensified back to tropical storm status.[65] As Cristobal moved further north into the Gulf of Mexico, dry air and interaction with an upper-level trough to the east began to strip Cristobal of any central convection, with most of the convection being displaced east and north of the center.[66][67] Just after 22:00 UTC on June 7, Cristobal made landfall over southeastern Louisiana. Cristobal weakened to a tropical depression the next day as it moved inland over the state.[68] Cristobal, however, survived as a depression as it moved up the Mississippi River Valley, with its barometric pressure falling, until finally becoming extratropical at 03:00 UTC on June 10 over southern Wisconsin.[69]
On June 1, the government of Mexico issued a tropical storm warning from Campeche westward to Puerto de Veracruz.[70] Residents at risk were evacuated. Nine thousand Mexican National Guard members were summoned to aid in preparations and repairs.[71] Significant rain fell across much of Southern Mexico and Central America. Wave heights up to 9.8 ft (3 m) high closed ports for several days. In El Salvador, a mudslide caused 7 people to go missing. Up to 9.6 in (243 mm) of rain fell in the Yucatan Peninsula, flooding sections of a highway. Street flooding occurred as far away as Nicaragua.[71] On June 5, while Cristobal was still a tropical depression, a tropical storm watch was issued from Punta Herrero to Rio Lagartos by the government of Mexico[72] as well as for another area from Intracoastal City, Louisiana to the Florida-Alabama border, issued by the National Weather Service.[73] These areas were later upgraded to warnings and for the Gulf Coast, the warning was extended to the Okaloosa/Walton County line.
Tropical Storm Dolly
| Tropical storm (SSHWS) | |
  | |
| Duration | June 22 – June 24 |
|---|---|
| Peak intensity | 45 mph (75 km/h) (1-min) 1002 mbar (hPa) |
On June 19, the NHC began monitoring an area of disturbed weather off the southeastern U.S. coast for possible subtropical development in the short term.[74] Slowly moving northwest, the system developed into a more defined non-tropical low pressure system by early on June 21.[75] However, at the time, the low pressure system was not considered likely to develop due to unfavorable sea surface temperatures.[76] The system's circulation slowly grew more defined throughout the day and some thunderstorms began to develop near the circulation, but the system exited the warmer waters of the Gulf Stream later that same evening and began to lose any convection that developed.[77] Contrary to predictions, the low moved south back into the Gulf Stream in the afternoon of June 22, and new thunderstorm activity began to fire near the circulation.[78] The low's convective activity rapidly became more defined and well organized while the circulation became closed, prompting the National Hurricane Center to upgrade the system into Subtropical Depression Four at around 21:00 UTC on June 22.[79] On June 23, the system's wind field had contracted significantly, becoming more characteristic of a tropical cyclone, while also strengthening further with winds to gale force, allowing the NHC to upgrade the system and designate it as Tropical Storm Dolly at approximately 16:15 UTC with winds of 45 mph (72 km/h).[80] This event marked the third-earliest occurrence of the fourth named storm in the calendar year on record, behind only Tropical Storm Debby of 2012 and Tropical Storm Danielle of 2016.[5][81] However, Dolly's peak intensity proved to be short-lived as its central convection began to diminish while it drifted over colder ocean waters, and the storm consequently weakened.[82] At 15:00 UTC on June 24, Dolly became a post-tropical cyclone, with any remaining convection displaced well to the system's south and the remaining circulation exposed.[83]
Tropical Storm Edouard
| Tropical storm (SSHWS) | |
  | |
| Duration | July 4 – July 7 |
|---|---|
| Peak intensity | 45 mph (75 km/h) (1-min) 1007 mbar (hPa) |
On July 1, a cluster of thunderstorms known as a mesoscale convective vortex formed over the northern Tennessee Valley in association with a stalled front pattern and slowly moved southeastwards.[84] By July 2, the remnant mesolow emerged off the coast of Georgia.[85] As the system gradually drifted over warm sea surface temperatures near the coast, some organized thunderstorm activity blossomed near the center of the system throughout July 3 and helped the system develop a more defined low level circulation,[86] and the NHC began monitoring the low around 00:00 UTC on July 4.[87] Just four hours later, the circulation of the low subsequently became better defined and closed as evidenced by satellite-derived surface wind data.[88] The disturbance rapidly developed over the next couple of hours, and at 15:00 UTC on July 4 the NHC issued its first advisory on the system as Tropical Depression Five.[89]
The system gradually drifted north-northeast towards Bermuda while the system's central thunderstorm activity began to decrease as a result of the diurnal minimum.[90] Little change in intensity occurred as the storm passed just 70 miles (110 km) north of Bermuda around 09:00 UTC on July 5.[91][92] Shortly after, the storm began to accelerate northeast continuing to lack in strength, having been forecast to become a tropical storm for at least 24 hours but failing to reach the intensity,[93] until a large burst of convection as a result of baroclinic forces allowed the system to tighten its circulation further and strengthen, allowing the National Hurricane Center to upgrade the system to Tropical Storm Edouard at 03:00 UTC on July 6.[94] This made Edouard the earliest fifth named storm on record in the North Atlantic Ocean, surpassing Hurricane Emily, which became a tropical storm on July 11, 2005.[94] Edouard intensified further to a peak intensity of 1007 mb (29.74 inHg) and with maximum sustained winds of 45 mph (75 km/h) at 18:00 UTC that same day as a frontal boundary approached Edouard from the northwest, effectively triggering extratropical transition[95], which it completed 3 hours later while located about 450 miles southeast of Cape Race, Newfoundland.[96][97] The extratropical remnants of the storm would continue to travel eastward for several days before finally dissipating over the Baltic Sea.
The Bermuda Weather Service issued a gale warning for the entirety of the island chain in advance of the system on July 4.[98] Unsettled weather with thunderstorms later ensued, and the depression caused tropical storm-force wind gusts and moderate rainfall on the island early on July 5, but impacts were relatively minor.[98][99]
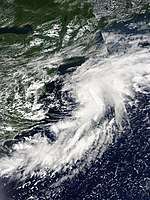
Tropical Storm Fay
| Tropical storm (SSHWS) | |
  | |
| Duration | July 9 – July 11 |
|---|---|
| Peak intensity | 60 mph (95 km/h) (1-min) 998 mbar (hPa) |
At 00:00 UTC July 5, shortly after the formation of Tropical Storm Edouard, the NHC began to track an area of disorganized cloudiness and showers in relation to a nearly stationary surface trough in the Gulf of Mexico.[100] After meandering over the Gulf, the disturbance moved northeast towards the coast of the Florida Panhandle, and would subsequently move inland by 12:00 UTC July 6.[101] 2 days later, the system re-emerged over the coast of Georgia.[102] Once offshore, the system began to organize as deep convection blossomed over the warm waters of the Gulf Stream.[103] Three hours later, data from a Hurricane Hunter Reconnaissance Aircraft along with satellite and radar imagery showed that the center had reformed near the edge of the primary convective mass, prompting the NHC to initiate advisories on Tropical Storm Fay at 21:00 UTC, located just 40 miles east-northeast of Cape Hatteras.[104][105]
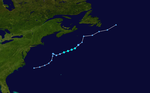
Immediately upon formation, tropical storm warnings were issued for the coasts of New Jersey, New York, and Connecticut, as the system moved north at 7 mph.[104] Fay intensified slightly to 50 mph by 09:00 UTC July 10 as it moved north.[106] Three hours later, surface observations and radar data showed that gale-force winds now stretched to the system's northwest; which caused a tropical storm warning to be issued along the coast of Delaware.[107] Fay continued to strengthen and reached its peak intensity with 60 mph winds and a minimum barometric pressure of 999 milllibars.[108][109] Fay made landfall east-northeast of Atlantic City, New Jersey at 21:00 UTC July 10.[110] Just six hours after making landfall, satellite and radar data showed Fay was no longer generating organized deep convection as it rapidly weakened inland.[111][112] At 06:00 UTC July 11, Fay weakened to a tropical depression situated 50 miles north of New York City, and degenerated into a post-tropical cyclone three hours later, located 30 miles south of Albany, New York.[113][114][115]
Six people were directly killed due to rip currents and storm surge associated with Fay. Overall, losses from the storm on the US Eastern Coast were estimated at a preliminary US$400 million based on wind and storm surge damage on residential, commercial, and industrial properties.[116] Fay's July 9 formation was the earliest for a sixth named storm in the Atlantic, surpassing the record set by Tropical Storm Franklin, which formed on July 21, 2005.[117]
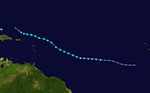
Tropical Storm Gonzalo
| Tropical storm (SSHWS) | |
  | |
| Duration | July 21 – July 25 |
|---|---|
| Peak intensity | 65 mph (100 km/h) (1-min) 997 mbar (hPa) |
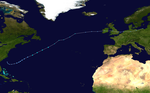
Early on July 20, the NHC began monitoring a tropical wave over the central tropical Atlantic for possible tropical cyclone development.[118] Though in an area of only somewhat conducive conditions,[119] the wave rapidly became better organized as it moved quickly westward. By 21:00 UTC July 21, satellite imagery and scatterometer data indicated that the small low pressure system had acquired a well-defined circulation as well as sufficiently organized convection to be designated Tropical Depression Seven.[120] At 12:50 UTC on July 22, the NHC upgraded the depression to Tropical Storm Gonzalo.[121] Gonzalo continued to intensify throughout the day, with an eyewall under a central dense overcast and hints of a developing eye becoming evident.[122] Gonzalo would then reach its peak intensity with wind speeds of 65 mph and a minimum central pressure of 997 mbar at 09:00 UTC the next day.[123] However, strengthening was halted as its central dense overcast was significantly disrupted when the storm entrained very dry air into its circulation from the Saharan Air Layer to its north.[124] Convection soon redeveloped over Gonzalo's center as the system attempted to mix out the dry air from its' circulation,[125] but the tropical storm did not strengthen further due to the hostile conditions. After making landfall on the island of Trinidad as a weak tropical storm, Gonzalo weakened to a tropical depression at 18:00 UTC on July 25. Three hours later, Gonzalo opened up into a tropical wave as it made landfall in northern Venezuela.[126]
Gonzalo was the earliest recorded seventh named storm in the Atlantic basin. The previous record holder was Tropical Storm Gert, which formed on July 24, 2005.[127] On July 23, hurricane watches were issued for Barbados, St Vincent and the Grenadines, and a tropical storm watch was issued later that day for Grenada and Trinidad and Tobago.[128] After Gonzalo failed to strengthen into a hurricane on July 24, the hurricane and tropical storm watches were replaced with tropical storm warnings.[129] Tropical Storm Gonzalo brought squally weather to Trinidad and Tobago and parts of southern Grenada and northern Venezuela on July 25.[130] However, the storm's impact ended up being significantly smaller than originally anticipated.[131] The Tobago Emergency Management Agency only received two reports of damage on the island: a fallen tree on a health facility in Les Coteaux and a damaged bus stop roof in Argyle.[132]
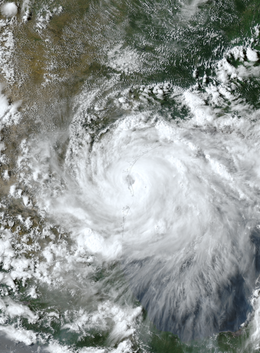
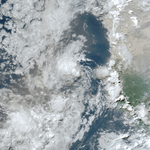
Hurricane Hanna
| Category 1 hurricane (SSHWS) | |
  | |
| Duration | July 23 – July 27 |
|---|---|
| Peak intensity | 90 mph (150 km/h) (1-min) 973 mbar (hPa) |
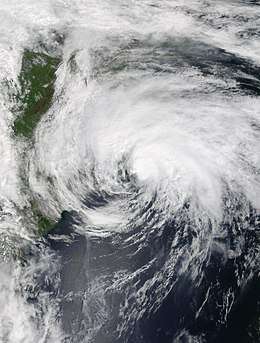
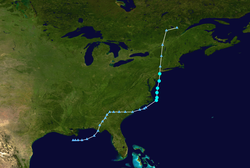
At 06:00 UTC July 19, the NHC noted a tropical wave over eastern Hispaniola and the nearby waters for possible development.[133] The disturbance moved generally west-northwestwards towards Cuba and the Straits of Florida, passing through the latter by 12:00 UTC July 21.[134] In the Gulf of Mexico, where conditions were more favorable for development,[135][136] the system began to steadily organize as a broad low pressure area formed within it.[137] Surface observations along with data from an Air Force Hurricane Hunter Aircraft showed that the area of low pressure developed a closed circulation along with a well-defined center, prompting the NHC to issue advisories on Tropical Depression Eight at 03:00 UTC July 23.[138] The depression continued to become better organized throughout the day, and 24 hours after forming, it strengthened into a tropical storm, receiving the name Hanna.[139] With the system's intensification to a tropical storm on July 24, it broke the record for the earliest eighth named storm, being named 10 days earlier than the previous record of August 3, set by Tropical Storm Harvey in 2005.[140]
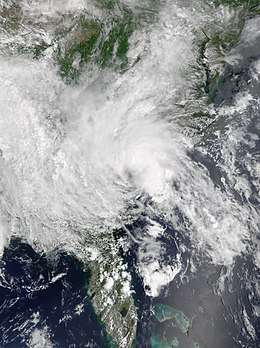
The system tracked westwards and steadily strengthened.[141] Over the ensuing 24 hours, Hanna underwent rapid intensification as its inner core and convection became better organized.[142] By 12:00 UTC July 25, radar and data from another Hurricane Hunter Aircraft showed that Hanna had intensified into the first hurricane of the season.[143] Hanna continued to strengthen further, reaching its peak intensity with 90 miles per hour (140 km/h) winds by 21:00 UTC on July 25, before making landfall an hour later at Padre Island, Texas.[144] After making a second landfall in Kenedy County, Texas at the same intensity at 23:15 UTC, the system then began to rapidly weaken, dropping to tropical depression status at 22:15 UTC the next day after crossing into Northeastern Mexico.[145][146] Hanna was the first hurricane to make landfall in Texas since Hurricane Harvey in 2017.
Immediately after the system was classified as a tropical depression, tropical storm watches were issued for much of the Texas shoreline.[147] At 21:00 UTC July 24, a hurricane warning was issued from Baffin Bay to Mesquite Bay, Texas, due to Hanna being forecast to become a hurricane before landfall.[148] The storm brought storm surge flooding, destructive winds, torrential rainfall, flash flooding and isolated tornadoes to an area already hard hit by the coronavirus. At least five fatalities have been reported.[149]
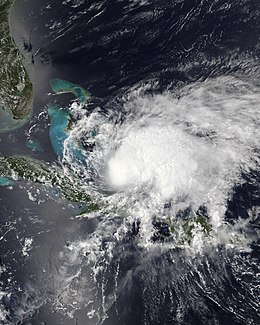
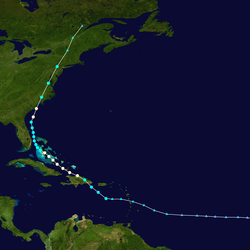
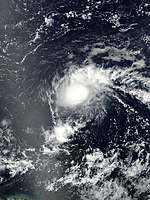
Hurricane Isaias
| Category 1 hurricane (SSHWS) | |
  | |
| Duration | July 30 – August 5 |
|---|---|
| Peak intensity | 85 mph (140 km/h) (1-min) 987 mbar (hPa) |
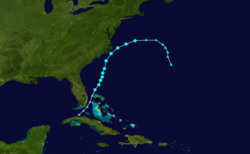
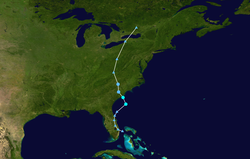
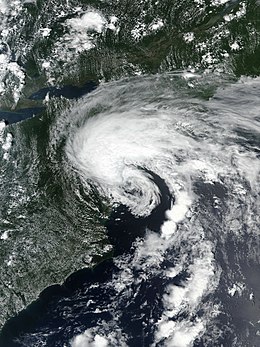
The National Hurricane Center first began tracking a vigorous tropical wave off the coast of Africa on July 23.[150] The wave gradually organized and became better defined, developing a broad area of low pressure.[151] Although the system lacked a well-defined center, its threat of tropical-storm-force winds to land areas prompted its designation as Potential Tropical Cyclone Nine at 15:00 UTC on July 28.[152] The system moved just south of Dominica, and at 03:00 UTC on July 30, it organized into a tropical cyclone. Due to its precursor disturbance already having gale-force winds, it was immediately declared a tropical storm and given the name "Isaias".[153] On the following day, Isaias passed south of Puerto Rico and made landfall on the Dominican Republic. At 03:40 UTC on July 31, Isaias strengthened into a hurricane as it pulled away from the Greater Antilles.[154] The storm fluctuated in intensity afterwards, due to strong wind shear and dry air, with its winds peaking at 85 miles per hour (137 km/h) and its central pressure falling to 987 millibars (29.1 inHg). At 15:00 UTC on August 1, Isaias made landfall on North Andros, Bahamas with winds around 80 miles per hour (130 km/h),[155] and the system weakened to a tropical storm at 21:00 UTC.[156] It then turned north-northwest, paralleling the east coast of Florida and Georgia while fluctuating between 65–70 miles per hour (105–113 km/h) wind speeds. As the storm accelerated northeastward and approached the Carolina coastline, wind shear relaxed, allowing the storm to quickly intensify back into a Category 1 hurricane at 00:00 UTC on August 4,[157][158] and at 03:10 UTC, Isaias made landfall on Ocean Isle Beach, North Carolina, with 1-minute sustained winds of 85 miles per hour (137 km/h).[159] Following landfall, Isaias accelerated and only weakened slowly, dropping below hurricane status at 07:00 UTC over North Carolina.[160] The storm passed over the Mid-Atlantic states and New England before transitioning into an extratropical cyclone near the American-Canadian border, and subsequently weakening progressing into Quebec.
When Isaias formed as a tropical storm, it became the earliest ninth named storm on record, breaking the record of Hurricane Irene of 2005 by eight days. With its landfall on August 4, it became the earliest fifth named storm to make landfall in the United States. The previous record for the earliest fifth storm to make a U.S. landfall was August 18, set during the 1916 season.[161] Numerous tropical storm watches and warnings as well as hurricane watches and hurricane warnings were issued for the Lesser Antilles, Greater Antilles, Bahamas, Cuba, and the entire East Coast of the United States. Isaias caused devastating flooding and wind damage in Puerto Rico and the Dominican Republic. Several towns were left without electricity and drinking water in Puerto Rico, which prompted a disaster declaration by President Donald Trump. In the Dominican Republic, two people were killed by wind damage. A woman was killed in Puerto Rico after being swept away in flood waters. 109 tornado warnings were issued in 12 states, including one for Hampton Roads. Two people were killed in Bertie County, North Carolina on August 4 due to an EF3 tornado striking a mobile home park. This was the strongest tropical cyclone spawned tornado since Hurricane Rita produced an F3 tornado in Clayton, Louisiana on September 24, 2005.[162] Five more fatalities occurred in St. Mary's County, Maryland; Milford, Delaware; Naugatuck, Connecticut; North Conway, New Hampshire; and New York City due to falling trees. One woman died when her vehicle was swept downstream in a flooded area of Lehigh County, Pennsylvania,[163] and a child was found dead in Lansdale, Pennsylvania after going missing during the height of the storm.[164] One man drowned due to strong currents in Cape May, New Jersey.[165] Preliminary damage estimates were in excess of US$4.2 billion, making Isaias the costliest tropical cyclone to strike the U.S. Northeast since Hurricane Sandy in 2012.[166]
Tropical Depression Ten
| Tropical depression (SSHWS) | |
  | |
| Duration | July 31 – August 2 |
|---|---|
| Peak intensity | 35 mph (55 km/h) (1-min) 1007 mbar (hPa) |
At 09:00 UTC July 30, the NHC began to monitor a broad area of low pressure associated with a tropical wave southeast of the Cabo Verde Islands.[167] Throughout the day, thunderstorm activity increased in association with the system and became better organized, only to become disorganized again on the next day.[168][169] Contrary to predictions, the system rapidly re-organized, and at 21:00 UTC on July 31, the NHC issued advisories on Tropical Depression Ten.[170] The system showed signs of further organization, although it failed to achieve tropical storm status, as was previously predicted; however, the NHC noted that the system may have briefly attained tropical storm status.[171] After maintaining its intensity for 12 hours, the cyclone began to weaken as it entered colder waters north of the Cabo Verde islands,[172] and the system degenerated into a trough at 03:00 UTC on August 2.[173]
Tropical Storm Josephine
| Tropical storm (SSHWS) | |
  | |
| Duration | August 11 – August 16 |
|---|---|
| Peak intensity | 45 mph (75 km/h) (1-min) 1004 mbar (hPa) |
On August 7, the NHC began monitoring a tropical wave over the tropical Atlantic.[174] Slowly drifting westward, the wave initially struggled to become organized as it was placed within a relatively unfavorable environment.[175] However, the wave's circulation slowly became more defined while signs of convective organization became evident on satellite imagery. Soon enough the circulation became no longer elongated and the system was designated a tropical depression at 21:00 UTC, August 11.[176][177] Intensification was slow for the depression as dry air and wind shear prevented much development.[178] After 2 days of little change in intensity, the depression moved into more favorable conditions and intensified into Tropical Storm Josephine at 15:00 UTC, August 13.[179] Josephine became the earliest tenth named storm on record in the basin, exceeding Tropical Storm Jose of 2005.[179] Josephine fluctuated in intensity due to little change in vertical wind shear slightly displacing the circulation from the deep convection.[180] Hurricane Hunter aircraft investigated the system later on August 14 and found that the storm's center had likely relocated further north in the afternoon hours.[181] Nonetheless, Josephine continued to move into increasingly hostile conditions as it started to pass north of the Leeward Islands.[182] As a result the storm later weakened, becoming a tropical depression early on August 16, just north of the Virgin Islands.[183] The weakening cyclone’s circulation became increasingly ill-defined, and Josephine eventually degenerated into a trough of low pressure later that day.[184]
Tropical Storm Kyle
| Tropical storm (SSHWS) | |
  | |
| Duration | August 14 – August 16 |
|---|---|
| Peak intensity | 50 mph (85 km/h) (1-min) 1000 mbar (hPa) |
On August 13, the NHC began to track an area of low pressure located over eastern North Carolina.[185] Warm water temperatures in the Atlantic allowed the system to rapidly organize, and at 21:00 UTC on August 14, the NHC designated the system as Tropical Storm Kyle. It was the earliest eleventh named North Atlantic storm, beating the record of Hurricane Katrina in 2005 by 10 days.[186] By mid-day on August 15, Kyle had reached its peak intensity with maximum sustained winds of 50 mph (80 km/h) and a minimum pressure of 1000 mb (29.53 inHg), at the same time the circulation quickly started to become elongated.[187] As a result the system began to rapidly lose its tropical characteristics with its circulation becoming very elongated and stretched out, ultimately leading to Kyle becoming a post-tropical cyclone early on August 16.[188]
Storm names
The following list of names will be used for named storms that form in the North Atlantic in 2020. Retired names, if any, will be announced by the World Meteorological Organization during the joint 42nd and 43rd Sessions of the RA IV Hurricane Committee in the spring of 2021 (in concurrence with any names from the 2019 season).[189] The names not retired from this list will be used again in the 2026 season. This is the same list used in the 2014 season, as no names were retired from that year. The name Isaias was used for the first time this year. Isaias was the replacement name for Ike after 2008, but went unused in 2014.
|
Season effects
This is a table of all of the storms that have formed in the 2020 Atlantic hurricane season. It includes their duration, names, landfall(s)—denoted by bold location names, damages, and death totals. Deaths in parentheses are additional and indirect (an example of an indirect death would be a traffic accident), but were still related to that storm. Damage and deaths include totals while the storm was extratropical, a wave, or a low, and all of the damage figures are in 2020 U.S. dollars.
| Saffir–Simpson scale | ||||||
| TD | TS | C1 | C2 | C3 | C4 | C5 |
| Storm name |
Dates active | Storm category
at peak intensity |
Max 1-min wind mph (km/h) |
Min. press. (mbar) |
Areas affected | Damage (USD) |
Deaths | Refs | ||
|---|---|---|---|---|---|---|---|---|---|---|
| Arthur | May 16 – 19 | Tropical storm | 60 (95) | 991 | Florida, The Bahamas, North Carolina, Bermuda | Minimal | None | |||
| Bertha | May 27 – 28 | Tropical storm | 50 (85) | 1004 | Florida, The Bahamas, East Coast of the United States | >$200 million | 1 | [52][54] | ||
| Cristobal | June 1 – 10 | Tropical storm | 60 (95) | 992 | Central America, Mexico, Central United States, Eastern Canada | $675 million | 15 | [190][191][192][193][194][195] | ||
| Dolly | June 22 – 24 | Tropical storm | 45 (75) | 1002 | East Coast of the United States, Nova Scotia | None | None | |||
| Edouard | July 4 – 6 | Tropical storm | 45 (75) | 1007 | Bermuda, British Isles, Germany, United Kingdom, Ireland, Poland, Western Russia | Minimal | None | |||
| Fay | July 9 – 11 | Tropical storm | 60 (95) | 998 | Southeastern United States, Northeastern United States, Eastern Canada | $400 million | 6 | [196][197][198][199] | ||
| Gonzalo | July 21 – 25 | Tropical storm | 65 (100) | 997 | Windward Islands, Trinidad and Tobago, Venezuela, Leeward Islands | Minimal | None | |||
| Hanna | July 23 – 27 | Category 1 hurricane | 90 (150) | 973 | Hispaniola, Cuba, Gulf Coast of the United States, Mexico | $485 million | 5 | [200][201][202][203] | ||
| Isaias | July 30 – August 5 | Category 1 hurricane | 85 (140) | 987 | West Africa, Leeward Islands, Puerto Rico, Hispaniola, Turks and Caicos Islands, The Bahamas, East Coast of the United States, Eastern Canada | >$4.2 billion | 18 | [204][205][162][206][207] [208][209][210][211][212] [213][214][215][166] | ||
| Ten | July 31 – August 2 | Tropical depression | 35 (55) | 1007 | West Africa, Cabo Verde Islands | None | None | |||
| Josephine | August 11 – 16 | Tropical storm | 45 (75) | 1004 | None | None | None | |||
| Kyle | August 14 – 16 | Tropical storm | 50 (85) | 1000 | East Coast of the United States, Nova Scotia | None | None | |||
| Season aggregates | ||||||||||
| 12 systems | May 16 – Present | 90 (150) | 973 | >$5.960 billion | 45 | |||||
See also
- Tropical cyclones in 2020
- Atlantic hurricane season
- List of Atlantic hurricane records
- List of wettest tropical cyclones
- 2020 Pacific hurricane season
- 2020 Pacific typhoon season
- 2020 North Indian Ocean cyclone season
- South-West Indian Ocean cyclone seasons: 2019–20, 2020–21
- Australian region cyclone seasons: 2019–20, 2020–21
- South Pacific cyclone seasons: 2019–20, 2020–21
Notes
- The totals represent the sum of the squares for every (sub)tropical storm's intensity of over 33 knots (38 mph; 61 km/h), divided by 10,000. Calculations are provided at Talk:2020 Atlantic hurricane season/ACE calcs.
References
- McGrath, Kimberly Miller and Gareth. "Hurricanes in a pandemic: 'Absolutely that's our nightmare scenario'". USA TODAY. Retrieved April 4, 2020.
- Shepherd, Marshall. "Coronavirus And An Active Hurricane Season Are Bad News - 3 Concerns As Gonzalo Forms". Forbes. Retrieved August 4, 2020.
- Ferman, Mitchell (July 24, 2020). "Corpus Christi, already a coronavirus hot spot, braces for Hurricane Hanna". The Texas Tribune. Retrieved July 25, 2020.
- "Background Information: The North Atlantic Hurricane Season". Climate Prediction Center. National Oceanic and Atmospheric Administration. August 9, 2012. Retrieved December 13, 2019.
- "Atlantic hurricane best track (HURDAT version 2)" (Database). United States National Hurricane Center. May 25, 2020.
- Mark Saunders; Adam Lea (December 19, 2019). "Extended Range Forecast for Atlantic Hurricane Activity in 2020" (PDF). University College London. Tropical Storm Risk. Retrieved December 19, 2019.
- Phil Klotzbach; Michael Bell; Jhordanne Jones (April 2, 2020). Extended Range Forecast of Atlantic Seasonal Hurricane Activity and Landfall Strike Probability for 2020 (PDF) (Report). Colorado State University. Retrieved April 2, 2020.
- Mark Saunders; Adam Lea (April 7, 2020). "April Forecast Update for North Atlantic Hurricane Activity in 2020" (PDF). University College London. Tropical Storm Risk. Retrieved April 8, 2020.
- Kyle Davis; Xubin Zeng (April 14, 2020). "University of Arizona (UA) April Forecast for North Atlantic Hurricane Activity in 2020" (PDF). University of Arizona. University of Arizona. Retrieved April 14, 2020.
- Brian Donegan; Jonathan Belles (April 16, 2020). "2020 Atlantic Hurricane Season Expected to Be More Active Than Usual, The Weather Company Outlook Says". The Weather Channel. Retrieved April 16, 2020.
- Tracey Peake; Lian Xie (April 17, 2020). "2020 Hurricane Season Will Be Active, NC State Researchers Predict". North Carolina State University. Retrieved April 17, 2020.
- "Pronóstico de Ciclones Tropicales 2020". SMN. May 20, 2020. Retrieved May 20, 2020.
- "North Atlantic tropical storm seasonal forecast 2020". Met Office. May 20, 2020. Retrieved May 20, 2020.
- "NOAA 2020 Atlantic Hurricane Season Outlook". Climate Prediction Center. May 21, 2020. Retrieved May 21, 2020.
- "Acccuweather 2020 Atlantic Hurricane Season Outlook". Accuweather. May 25, 2020. Retrieved May 25, 2020.
- "Pre-Season Forecast for North Atlantic Hurricane Activity in 2020" (PDF). Tropical Storm Risk. May 28, 2020. Retrieved May 28, 2020.
- "EXTENDED RANGE FORECAST OF ATLANTIC SEASONAL HURRICANE ACTIVITY AND LANDFALL STRIKE PROBABILITY FOR 2020" (PDF). Colorado State University. June 4, 2020. Retrieved June 4, 2020.
- Kyle Davis; Xubin Zeng (June 12, 2020). "University of Arizona (UA) June Forecast for North Atlantic Hurricane Activity in 2020". University of Arizona. Retrieved June 13, 2020.
- "EXTENDED RANGE FORECAST OF ATLANTIC SEASONAL HURRICANEACTIVITY AND LANDFALL STRIKE PROBABILITY FOR 2020" (PDF). Colorado State University. July 7, 2020. Retrieved July 7, 2020.
- "July Forecast for North Atlantic Hurricane Activity in 2020" (PDF). Tropical Storm Risk. July 7, 2020. Retrieved July 7, 2020.
- "Active Atlantic Hurricane Season Outlook Update". The Weather Channel. July 16, 2020. Retrieved July 16, 2020.
- "Accuweather 2020 Atlantic Hurricane Season Outlook". Accuweather. July 30, 2020. Retrieved July 30, 2020.
- "FORECAST OF ATLANTIC SEASONAL HURRICANE ACTIVITY AND LANDFALL STRIKE PROBABILITY FOR 2020" (PDF). Colorado State University. August 5, 2020. Retrieved August 5, 2020.
- "August Forecast Update for North Atlantic Hurricane Activity in 2020" (PDF). Tropical Storm Risk. August 5, 2020. Retrieved August 7, 2020.
- "'Extremely active' hurricane season possible for Atlantic Basin". Climate Prediction Center. August 6, 2020. Retrieved August 6, 2020.
- "NOAA's Atlantic Hurricane Season Classifications". National Oceanic and Atmospheric Administration. National Hurricane Center. May 22, 2008. Retrieved December 13, 2019.
- https://tropical.colostate.edu/Forecast/2020-08.pdf
- http://www.tropicalstormrisk.com/docs/TSRATLForecastAug2020.pdf
- "'Extremely active' hurricane season possible for Atlantic Basin | National Oceanic and Atmospheric Administration". www.noaa.gov. Retrieved August 6, 2020.
- @stevebowenwx (July 30, 2020). "2020 joins 2005 as the most active July in the official record for named storm formation in the Atlantic Ocean" (Tweet) – via Twitter.
- Daniel Brown (May 14, 2020). "NHC Graphical Outlook Archive". National Hurricane Center. Retrieved May 16, 2020.
- John Cangialosi (May 16, 2020). "Tropical Depression One Discussion Number 1". National Hurricane Center. Retrieved May 16, 2020.
- Stacy Stewart (May 16, 2020). "Tropical Storm Arthur Discussion Number 2". National Hurricane Center. Retrieved May 16, 2020.
- "Tropical Storm Arthur Discussion 6". nhc.noaa.gov. Retrieved May 18, 2020.
- "Tropical Storm Arthur Discussion 5". nhc.noaa.gov. Retrieved May 18, 2020.
- "Tropical Storm Arthur Discussion 8". nhc.noaa.gov. Retrieved May 18, 2020.
- "Tropical Storm Arthur Forecast Discussion". nhc.noaa.gov. Retrieved May 18, 2020.
- "Post-Tropical Cyclone Arthur Forecast Discussion". nhc.noaa.gov. Retrieved May 19, 2020.
- "Tropical Storm Arthur Forms Off Southeast Coast; Tropical Storm Watch Issued". The Weather Channel. May 16, 2020. Retrieved May 16, 2020.
- "NHC Graphical Outlook Archive". nhc.noaa.gov. Retrieved May 27, 2020.
- "Tropical Storm BERTHA". nhc.noaa.gov. Retrieved May 27, 2020.
- "Tropical Storm BERTHA". nhc.noaa.gov. Retrieved May 28, 2020.
- "Tropical Storm BERTHA". nhc.noaa.gov. Retrieved May 27, 2020.
- "Remnants of Gonzalo Public Advisory". www.nhc.noaa.gov.
- "Post-Tropical Cyclone Bertha Public Advisory". www.nhc.noaa.gov.
- 72-hour Precipitation Reports (Updated by County) (Report). Iowa Environmental Mesonet. National Weather Service Weather Forecast Office in Miami, Florida. May 27, 2020. Retrieved May 27, 2020.
- Lois Solomon; Victoria Ballard; Rafael Olmeda; Wayne Roustan (May 27, 2020). "Bertha downgraded to tropical depression; relentless rain to continue in saturated South Florida". Sun-Sentinel. Retrieved May 27, 2020.
- Christian De La Rosa; Liane Morejon (May 26, 2020). "Steady downpours bring costly flooding across South Florida". WPLG. Retrieved May 27, 2020.
- Liane Morejon; Janine Stanwood; Christian De La Rosa; Saira Anwer; Amanda Batchelor (May 25, 2020). "Flash flood warning in effect: South Floridians deal with rainfall, tornado, dangerous roads". WPLG. Retrieved May 27, 2020.
- NWS Damage Survey for 05/25/2020 Redlands Tornado Event Update 1 (Report). Iowa Environmental Mesonet. National Weather Service Weather Forecast Office in Miami, Florida. May 26, 2020. Retrieved May 27, 2020.
- 48-hour Highest Wind Reports (Report). Iowa Environmental Mesonet. National Weather Service Weather Forecast Office in Miami, Florida. May 26, 2020. Retrieved May 27, 2020.
- Summer Dashe (May 27, 2020). "Drowning reported in Myrtle Beach Wednesday after Tropical Storm Bertha hit coast". Retrieved May 30, 2020.
- Anstaett, Colter (May 28, 2020). "More rain threatens parts of Henry County hit hard by weekend flash flooding". WSLS. Retrieved June 3, 2020.
- http://thoughtleadership.aonbenfield.com//Documents/20200609_analytics-if-may-global-recap.pdf
- "NHC Graphical Outlook Archive". nhc.noaa.gov. Retrieved June 1, 2020.
- "NHC Graphical Outlook Archive". nhc.noaa.gov. Retrieved June 1, 2020.
- "Tropical Depression Three Forecast Discussion". nhc.noaa.gov. Retrieved June 2, 2020.
- "Tropical Storm Cristobal Update Statement". nhc.noaa.gov. Retrieved June 2, 2020.
- Phil Klotzbach [@philklotzbach] (June 2, 2020). "#Cristobal has formed in the Bay of Campeche - the 3rd Atlantic named storm of the 2020 season. This is the earliest date for an Atlantic 3rd named storm formation on record (since 1851). Old record was Colin on June 5, 2016" (Tweet). Retrieved June 2, 2020 – via Twitter.
- "Tropical Storm CRISTOBAL". nhc.noaa.gov. Retrieved June 3, 2020.
- "Tropical Storm CRISTOBAL". nhc.noaa.gov. Retrieved June 3, 2020.
- "Tropical Storm Cristobal Update Statement". nhc.noaa.gov. June 3, 2020. Retrieved June 3, 2020.
- "Tropical Depression Cristobal Forecast Discussion Number 12". nhc.noaa.gov. Retrieved June 4, 2020.
- "Tropical Depression Cristobal Forecast Discussion". nhc.noaa.gov. Retrieved June 5, 2020.
- "National Hurricane Center". web.archive.org. June 5, 2020. Retrieved June 5, 2020.
- "Tropical Storm Cristobal Discussion Number 19". National Hurricane Center.
- "Tropical Storm Cristobal Discussion Number 21". National Hurricane Center.
- "Tropical Storm Hanna Forecast Discussion". www.nhc.noaa.gov.
- Burke, Patrick C. (June 9, 2020). "Post-Tropical Cyclone Cristobal Advisory Number 34". College Park, Maryland: NWS Weather Prediction Center. Retrieved July 15, 2020.
- "National Hurricane Center". web.archive.org. June 1, 2020. Retrieved June 1, 2020.
- "Cristobal makes landfall in Mexico, could dump up to 30 inches of rain before heading for US".
- "Tropical Depression Cristobal Update Statement". nhc.noaa.gov. Retrieved June 5, 2020.
- "Tropical Depression Cristobal Public Advisory". nhc.noaa.gov. Retrieved June 5, 2020.
- "NHC Graphical Outlook Archive". www.nhc.noaa.gov.
- "NHC Graphical Outlook Archive". www.nhc.noaa.gov.
- Bianchi, Chris. "Tropics Update: Possible System in North Atlantic". WeatherNation. Retrieved June 22, 2020.
- "NHC Graphical Outlook Archive". www.nhc.noaa.gov.
- "NHC Graphical Outlook Archive". www.nhc.noaa.gov.
- "Subtropical Depression Four Discussion Number 1". National Hurricane Center.
- Berg, Ronnie; Brown, Daniel P. (June 23, 2020). "Tropical Storm Dolly Update Statement". National Hurricane Center and Central Pacific Hurricane Center. National Oceanic and Atmospheric Administration. Retrieved June 23, 2020.
- Klotzbach, Philip [@philklotzbach] (June 23, 2020). "Dolly has formed in the North Atlantic - the 3rd earliest 4th Atlantic named storm formation on record (since 1851). Danielle is earliest on 6/20/2016. Debby is 2nd earliest on 6/23/2012 at 12 UTC. Dolly in 2020 formed on June 23 at 1615 UTC. hurricane" (Tweet). Retrieved June 23, 2020 – via Twitter.
- "Tropical Storm Dolly Public Advisory". nhc.noaa.gov. Retrieved June 24, 2020.
- "Post-Tropical Cyclone Dolly Discussion Number 9". nhc.noaa.gov. Retrieved June 24, 2020.
- "Tropical Depression Five Tracking Away From Land in the Atlantic". The Weather Channel. Retrieved July 5, 2020.
- @pppapin (July 4, 2020). "twitter.com/pppapin/status/1278805436624367621" (Tweet). Retrieved July 4, 2020 – via Twitter.
- @pppapin (July 4, 2020). "twitter.com/pppapin/status/1279110480867414019" (Tweet). Retrieved July 4, 2020 – via Twitter.
- "NHC Graphical Outlook Archive". www.nhc.noaa.gov. Retrieved July 4, 2020.
- "NHC Graphical Outlook Archive". www.nhc.noaa.gov. Retrieved July 4, 2020.
- "National Hurricane Center". web.archive.org. July 4, 2020. Retrieved July 4, 2020.
- "Tropical Depression FIVE Forecast Discussion Number 3". www.nhc.noaa.gov. Retrieved July 5, 2020.
- "Tropical Depression FIVE Discussion Number 4". www.nhc.noaa.gov. Retrieved July 5, 2020.
- "Tropical Depression FIVE Public Advisory Number 4". www.nhc.noaa.gov. Retrieved July 5, 2020.
- "Tropical Depression FIVE Forecast Discussion Number 5". www.nhc.noaa.gov. Retrieved July 5, 2020.
- "Tropical Storm Edouard Forecast Discussion Number 7". www.nhc.noaa.gov. Retrieved July 6, 2020.
- "Tropical Storm Edouard Forecast Discussion Number 9". www.nhc.noaa.gov. Retrieved July 6, 2020.
- "Post-Tropical Cyclone Edouard Forecast Discussion". www.nhc.noaa.gov. Retrieved July 6, 2020.
- "Post-Tropical Cyclone Edouard Public Advisory". www.nhc.noaa.gov. Retrieved July 6, 2020.
- Pérez, Paola. "Tropical Depression 5 accelerates away from Bermuda; hurricane center watches low pressure area along northern Gulf Coast". orlandosentinel.com. Retrieved July 5, 2020.
- "Tropical Depression 5 no longer a threat". www.royalgazette.com. Royal Gazette. Retrieved July 5, 2020.
- "NHC Graphical Outlook Archive". www.nhc.noaa.gov. Retrieved July 10, 2020.
- "NHC Graphical Outlook Archive". www.nhc.noaa.gov. Retrieved July 10, 2020.
- "NHC Graphical Outlook Archive". www.nhc.noaa.gov. Retrieved July 10, 2020.
- "NHC Graphical Outlook Archive". www.nhc.noaa.gov. Retrieved July 10, 2020.
- "Tropical Storm FAY". www.nhc.noaa.gov. Retrieved July 10, 2020.
- "Tropical Storm FAY". www.nhc.noaa.gov. Retrieved July 10, 2020.
- "Tropical Storm FAY". www.nhc.noaa.gov. Retrieved July 10, 2020.
- "Tropical Storm Fay Forecast Discussion". www.nhc.noaa.gov. Retrieved July 10, 2020.
- "Tropical Storm FAY". www.nhc.noaa.gov. Retrieved July 10, 2020.
- "Tropical Storm Fay Forecast Discussion". www.nhc.noaa.gov. Retrieved July 10, 2020.
- "Tropical Storm Fay Public Advisory". www.nhc.noaa.gov. Retrieved July 10, 2020.
- "NHC Graphical Outlook Archive". www.nhc.noaa.gov. Retrieved July 19, 2020.
- "Tropical Storm FAY". www.nhc.noaa.gov. Retrieved July 19, 2020.
- "Tropical Depression FAY". www.nhc.noaa.gov. Retrieved July 19, 2020.
- "Post-Tropical Cyclone FAY". www.nhc.noaa.gov. Retrieved July 19, 2020.
- "Post-Tropical Cyclone FAY". www.nhc.noaa.gov. Retrieved July 19, 2020.
- "East Coast's Insured Loss From Tropical Storm Fay to Tally Near $400 Million: KCC". Insurance Journal. July 15, 2020. Retrieved July 15, 2020.
- Masters, Jeff (July 10, 2020). "Tropical Storm Fay brings heavy rains to mid-Atlantic, Northeast U.S." Yale Climate Connections. New Haven, Connecticut: Yale Center for Environmental Communication, Yale School of the Environment. Retrieved July 21, 2020.
- Stacy R. Stewart (July 20, 2020). "Five-Day Graphical Tropical Weather Outlook". www.nhc.noaa.gov. Miami, Florida: National Hurricane Center. Retrieved July 21, 2020.
- "Five-Day Graphical Tropical Weather Outlook". nhc.noaa.gov. July 21, 2020. Retrieved July 22, 2020.
- John L. Beven (July 21, 2020). "Tropical Depression Seven Discussion Number 1". www.nhc.noaa.gov. Miami, Florida: National Hurricane Center. Retrieved July 21, 2020.
- "Tropical Storm Gonzalo Update Statement". www.nhc.noaa.gov. Retrieved July 22, 2020.
- "Tropical Storm Gonzalo Discussion 4". nhc.noaa.gov. Retrieved July 22, 2020.
- "Tropical Storm Gonzalo Forecast Discussion". www.nhc.noaa.gov. Retrieved July 22, 2020.
- "Tropical Storm Gonzalo Forecast Discussion". www.nhc.noaa.gov. Retrieved July 23, 2020.
- "Tropical Storm Gonzalo Forecast Discussion". www.nhc.noaa.gov. Retrieved July 23, 2020.
- "Remnants of Gonzalo Public Advisory". nhc.noaa.gov. Retrieved July 26, 2020.
- Langmaid, Virginia; Jones, Judson (July 22, 2020). "Tropical Storm Gonzalo sets a record as it churns toward the Caribbean". CNN. Retrieved July 22, 2020.
- "Tropical Storm GONZALO". www.nhc.noaa.gov. Retrieved July 25, 2020.
- "Tropical Storm GONZALO". www.nhc.noaa.gov. Retrieved July 25, 2020.
- "Tropical Storm Gonzalo brings rain to Trinidad and Tobago". UPI. Retrieved July 25, 2020.
- https://weather.com/storms/hurricane/news/2020-07-25-tropical-storm-gonzalo-caribbean-trinidad-tobago. Missing or empty
|title=(help) - Connelly, Corey (July 25, 2020). "Gonzalo warning lifted for Trinidad and Tobago, storm fizzles to tropical depression". Trinidad and Tobago Newsday. Retrieved July 30, 2020.
- "NHC Graphical Outlook Archive". www.nhc.noaa.gov. Retrieved July 25, 2020.
- "NHC Graphical Outlook Archive". www.nhc.noaa.gov. Retrieved July 25, 2020.
- "NHC Graphical Outlook Archive". www.nhc.noaa.gov. Retrieved July 25, 2020.
- "NHC Graphical Outlook Archive". www.nhc.noaa.gov. Retrieved July 25, 2020.
- "NHC Graphical Outlook Archive". www.nhc.noaa.gov. Retrieved July 25, 2020.
- "Tropical Depression EIGHT". www.nhc.noaa.gov. Retrieved July 25, 2020.
- "Tropical Storm HANNA". www.nhc.noaa.gov. Retrieved July 25, 2020.
- Associated Press (July 24, 2020). "2020 Atlantic Hurricane Season Continues to Break Records With Tropical Storm Hanna". Time. Retrieved July 24, 2020.
- "Tropical Storm HANNA". www.nhc.noaa.gov. Retrieved July 26, 2020.
- "Tropical Storm HANNA". www.nhc.noaa.gov. Retrieved July 25, 2020.
- "Tropical Storm HANNA". www.nhc.noaa.gov. Retrieved July 25, 2020.
- "Hurricane Hanna Update Statement". www.nhc.noaa.gov. Retrieved July 25, 2020.
- "Hurricane HANNA". www.nhc.noaa.gov. Retrieved July 26, 2020.
- "Tropical Depression HANNA". www.nhc.noaa.gov. Retrieved July 26, 2020.
- "Tropical Depression EIGHT". www.nhc.noaa.gov. Retrieved July 25, 2020.
- "Tropical Storm HANNA". www.nhc.noaa.gov. Retrieved July 25, 2020.
- https://weather.com/safety/hurricane/news/2020-07-26-tropical-storm-hanna-south-texas-northeast-mexico-flooding-high
- Jack Beven (July 23, 2020). "Five-Day Graphical Tropical Weather Outlook". nhc.noaa.gov. Miami, Florida: National Hurricane Center. Retrieved July 28, 2020.
- Robbie Berg (July 26, 2020). "Two-Day Graphical Tropical Weather Outlook". www.nhc.noaa.gov. Miami, Florida: National Hurricane Center. Retrieved July 28, 2020.
- Daniel Brown (July 28, 2020). "Potential Tropical Cyclone Nine Discussion Number 1". www.nhc.noaa.gov. Miami, Florida: National Hurricane Center. Retrieved August 4, 2020.
- Richard Pasch (July 30, 2020). "Tropical Storm Isaias Discussion Number 7". www.nhc.noaa.gov. Miami, FL: National Hurricane Center. Retrieved July 30, 2020.
- Eric S. Blake (July 31, 2020). "Hurricane Isaias Special Discussion Number 12". www.nhc.noaa.gov. Miami, Florida: National Hurricane Center. Retrieved July 31, 2020.
- https://www.nhc.noaa.gov/archive/2020/al09/al092020.public.018.shtml?
- https://www.nhc.noaa.gov/archive/2020/al09/al092020.public.019.shtml?
- Jack Beven (August 4, 2020). "Hurricane Isaias Intermediate Adivsory Number 27A...Corrected". www.nhc.noaa.gov. Miami, Florida: National Hurricane Center. Retrieved August 4, 2020.
- David Zelinsky; Jack Beven (August 4, 2020). "Hurricane Isaias Tropical Cyclone Update". www.nhc.noaa.gov. Miami, Florida: National Hurricane Center. Retrieved August 4, 2020.
- Daniel Brown; David Zelinsky; Jack Beven (August 4, 2020). "Hurricane Isaias Tropical Cyclone Update". www.nhc.noaa.gov. Miami, Florida: National Hurricane Center. Retrieved August 4, 2020.
- Daniel Brown; Robbie Berg (August 4, 2020). "Tropical Storm Isaias Discussion Number 29". www.nhc.noaa.gov. Miami, Florida: National Hurricane Center. Retrieved August 4, 2020.
- Masters, Jeff (August 5, 2020) [August 2, 2020]. "Tropical Storm Isaias: Updates from 'Eye on the Storm'". New Haven, Connecticut: Yale Center for Environmental Communication. Retrieved August 5, 2020.
- "At least 2 people dead, 2 children missing after tornado touches down in Bertie County". www.abc11.com. August 4, 2020. Retrieved August 4, 2020.
- David Chang (August 4, 2020). "Girl and Teen Missing, 2 Women Dead After Isaias Rips Through Region". NBC Philadelphia. Retrieved August 4, 2020.
- David Chang, Rudy Chinchilla and Stephanía Jiménez (August 5, 2020). "Girl With Autism, Missing During Storms, Found Dead". NBC Philadelphia. Retrieved August 5, 2020.
- Allie Miller (August 4, 2020). "Man's body found in surf off Cape May beach". Philly Voice. Retrieved August 5, 2020.
- Katherine Chiglinskey (August 10, 2020). "Hurricane Isaias Expected to Cost Insurers $4 Billion in U.S." BBN Bloomberg. Retrieved August 11, 2020.
- John Cangialosi (July 30, 2020). "Two-Day Graphical Tropical Weather Outlook". www.nhc.noaa.gov. Miami, Florida: National Hurricane Center. Retrieved August 1, 2020.
- Dave Roberts (July 30, 2020). "Two-Day Graphical Tropical Weather Outlook". www.nhc.noaa.gov. Miami, Florida: National Hurricane Center. Retrieved August 1, 2020.
- Daniel Brown (July 31, 2020). "Two-Day Graphical Tropical Weather Outlook". www.nhc.noaa.gov. Miami, Florida: National Hurricane Center. Retrieved August 1, 2020.
- Daniel Brown (July 31, 2020). "Tropical Depression Ten Discussion Number 1". www.nhc.noaa.gov. Miami, Florida: National Hurricane Center. Retrieved August 1, 2020.
- David Zelinsky (August 1, 2020). "Tropical Depression Ten Discussion Number 2". www.nhc.noaa.gov. Miami, Florida: National Hurricane Center. Retrieved August 1, 2020.
- Andrew Latto (August 1, 2020). "Tropical Depression Ten Discussion Number 4". www.nhc.noaa.gov. Miami, Florida: National Hurricane Center. Retrieved August 1, 2020.
- David Zelinsky (August 2, 2020). "Remnants of Ten Discussion Number 6". www.nhc.noaa.gov. Miami, Florida: National Hurricane Center. Retrieved August 2, 2020.
- Andrew Latto (August 7, 2020). "Five-Day Graphical Tropical Weather Outlook". www.nhc.noaa.gov. Miami, Florida: National Hurricane Center. Retrieved August 11, 2020.
- "NHC Graphical Outlook Archive". www.nhc.noaa.gov. Retrieved August 15, 2020.
- "NHC Graphical Outlook Archive". www.nhc.noaa.gov. Retrieved August 15, 2020.
- "Tropical Depression ELEVEN Forecast Discussion Number 1". www.nhc.noaa.gov. Retrieved August 15, 2020.
- "Tropical Depression ELEVEN Forecast Discussion Number 2". www.nhc.noaa.gov. Retrieved August 15, 2020.
- "Tropical Storm JOSEPHINE Forecast Discussion Number 8". www.nhc.noaa.gov. Retrieved August 15, 2020.
- "Tropical Storm JOSEPHINE Forecast Discussion Number 11". www.nhc.noaa.gov. Retrieved August 15, 2020.
- "Tropical Storm JOSEPHINE Forecast Discussion Number 13". www.nhc.noaa.gov. Retrieved August 15, 2020.
- "Tropical Storm JOSEPHINE Public Advisory Number 16". www.nhc.noaa.gov. Retrieved August 15, 2020.
- "Tropical Depression Josephine Forecast Discussion Number 20". www.nhc.noaa.gov. Retrieved August 16, 2020.
- Dan Brown (August 16, 2020). "Remnants of Josephine Public Advisory Number 21". www.nhc.noaa.gov. Miami, Florida: National Hurricane Center. Retrieved August 16, 2020.
- Jack Beven (August 13, 2020). "Two-Day Graphical Tropical Weather Outlook, 200 PM EDT Thu Aug 13 2020". www.nhc.noaa.gov. Miami, Florida: National Hurricane Center. Retrieved August 14, 2020.
- David Zelinsky (August 14, 2020). "Tropical Storm Kyle Discussion Number 1". www.nhc.noaa.gov. Miami, Florida: National Hurricane Center. Retrieved August 14, 2020.
- David Zelinsky (August 15, 2020). "Tropical Storm Kyle Public Advisory Number 4". www.nhc.noaa.gov. Miami, Florida: National Hurricane Center. Retrieved August 15, 2020.
- Robbie Berg (August 16, 2020). "Tropical Storm Kyle Public Advisory Number 7". www.nhc.noaa.gov. Miami, Florida: National Hurricane Center. Retrieved August 16, 2020.
- "Why 2019's Hurricane Dorian Wasn't Retired by the World Meteorological Organization". The Weather Channel. Retrieved April 2, 2020.
- Ortiz, Graciela H.; Graniel, Gabriel (June 7, 2020). "Reportan dos muertos por afectaciones de "Cristóbal" en sureste". La Jordana (in Spanish). Retrieved June 8, 2020.
- "Tormenta tropical "Cristóbal" deja un muerto en Chiapas" (in Spanish). El Universal. June 4, 2020. Retrieved June 4, 2020.
- "Tropical Storm Cristobal spawns damaging tornado in Orlando; Louisiana brothers, 8 and 10, killed in rip current". FOX News. June 7, 2020. Retrieved June 7, 2020.
- "Teen drowns at Crystal Beach after grandmother lost sight of him". Houston, Texas: KTRK-TV. June 8, 2020. Retrieved July 14, 2020.
- "Global Catastrophe Recap: June 2020" (PDF). London, United Kingdom: Aon. pp. 4–5. Retrieved July 15, 2020.
- Spamer, Courtney (June 7, 2020). "Cristobal unleashes life-threatening flooding in Mexico, Central America despite weakening". AccuWeather. Retrieved July 31, 2020.
- Anthony DiLorenzo (July 10, 2020). "Teen drowns, 5 others rescued from strong currents in Long Beach as Tropical Storm Fay approaches". Retrieved July 10, 2020.
- Allison Pries and Anthony G. Attrino (July 11, 2020). "Teen who disappeared in rough surf at Jersey Shore presumed dead, cops say". Retrieved July 11, 2020.
- Jackson Cote (July 14, 2020). "64-year-old Matthew Smith of Fitchburg identified as victim of drowning off Scarborough Beach in Rhode Island". Retrieved July 14, 2020.
- "Swimmer goes missing trying to rescue family members at the Jersey Shore". July 14, 2020. Retrieved July 14, 2020.
- "Father, Mississippi deputy, drowns while saving 10-year-old son at Sandestin beach". Pensacola News Journal. July 23, 2020. Retrieved July 23, 2020.
- Pedro Pablo Cortés and María Julia Castañeda (July 27, 2020). "Hanna weakens after leaving 4 dead, 6 missing in Mexico". La Prensa Latina Media. Retrieved July 27, 2020.
- "Texas, Hawaii Spared From Potential Widespread Hurricane Damage". Claims Journal. July 28, 2020. Retrieved July 29, 2020.
- Lourdes Flores (August 14, 2020). "Nuevo León calcula daños de 3,000 millones de pesos por el huracán Hanna" (in Spanish). El Economista. Retrieved August 17, 2020.
- Ron Brackett (July 31, 2020). "Isaias Kills 2 in Dominican Republic; Dozens Rescued in Puerto Rico". The Weather Channel. Retrieved July 31, 2020.
- "Hallan sin vida a mujer que fue arrastrada por un golpe de agua en Rincón durante Isaías". El Nuevo Día. August 1, 2020. Retrieved August 1, 2020.
- "1 Killed After Tree Falls On Moving Vehicle In St. Mary's County As Tropical Storm Isaias Blew Through Maryland". CBS Baltimore. August 4, 2020. Retrieved August 4, 2020.
- "Person sitting in car in Queens crushed to death by tree toppled by Tropical Storm Isaias". New York Daily News. August 4, 2020. Retrieved August 4, 2020.
- David Chang (August 4, 2020). "Girl and Teen Missing, 2 Women Dead After Isaias Rips Through Region". NBC Philadelphia. Retrieved August 4, 2020.
- Allie Miller (August 4, 2020). "Man's body found in surf off Cape May beach". Philly Voice. Retrieved August 5, 2020.
- "North Conway, NH Woman Killed When Tree Falls On Apartment During Tropical Storm Isaias". CBS Boston. August 5, 2020. Retrieved August 5, 2020.
- David Chang, Rudy Chinchilla and Stephanía Jiménez (August 5, 2020). "Girl With Autism, Missing During Storms, Found Dead". NBC Philadelphia. Retrieved August 5, 2020.
- Dana Hedgpeth and Matthew Cappucci (August 5, 2020). "Seven tornadoes confirmed in Va. and Md., two dead as region recovers from Tropical Storm Isaias". Washington Post. Retrieved August 6, 2020.
- "60-year-old man dead after possible electrocution in New Jersey". New York, NY: WABC-TV. August 5, 2020. Retrieved August 5, 2020.
- Matthew Cappucci (August 6, 2020). "Two N.C. men were cleaning up from Hurricane Isaias. Lightning struck and killed them". The Washington Post. Retrieved August 6, 2020.
- Teresa Pellicano (August 6, 2020). "CT sees two Isaias-related deaths, five injuries". WTNH. Retrieved August 6, 2020.
External links
| Wikimedia Commons has media related to 2020 Atlantic hurricane season. |