Pulwama district
Pulwama, also known as Panwangam[2] and Pulgam,[3] is a district in the Indian Union territory of Jammu and Kashmir.
Pulwama District Panwangam, Pulgam | |
|---|---|
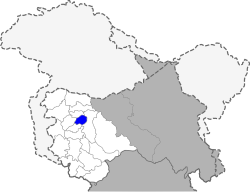 Pulwama District shown within Jammu & Kashmir union territory | |
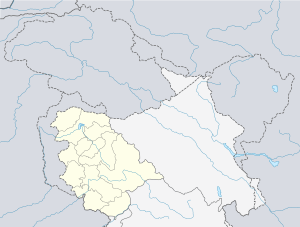 Pulwama District Location within Jammu and Kashmir | |
| Coordinates: 33°52′25″N 74°53′56″E | |
| Country | |
| Union territory | Jammu and Kashmir |
| Headquarters | Pulwama |
| Area | |
| • Total | 1,090 km2 (420 sq mi) |
| Elevation | 1,630 m (5,350 ft) |
| Population (2011) | |
| • Total | 560,440 |
| • Density | 510/km2 (1,300/sq mi) |
| • Literacy | 65.3% |
| Website | http://pulwama.gov.in |
Administration
In 1979 Anantnag district split in two, with one part remaining as Anantnag district, and the other part becoming Pulwama district.[4] When created, Pulwama district had 550 villages, grouped in five subdistricts (tehsils): Shopian, Awantipora, Pampore, Pulwama, and Tral.[5] After Shopian district was created in 2007, Pulwama district had 331 villages and four subdistricts.[5] According to the district administration, the area of the district is 420 square miles (1,090 km2).[1]
Pulwama district currently has eight subdistricts,[6] with 327 villages (eight of which are uninhabited):[1]
- Awantipora Tehsil
- Pampore Tehsil
- Pulwama Tehsil
- Tral Tehsil
- Rajpora Tehsil
- Aripal Tehsil
- Litter Tehsil
- KakaporaTehsil
This district consists of five development blocks: Tral, Keller, Pampore, Pulwama and Kakapora.[7] Each block consists of a number of panchayats.
Demographics
According to the 2011 census Pulwama district has a population of 560,440,[8] roughly equal to the nation of Solomon Islands[9] or the US state of Wyoming.[10] This gives it a ranking of 537th in India (out of a total of 640).[8] The district has a population density of 598 inhabitants per square kilometre (1,550/sq mi).[8] Its population growth rate over the decade 2001–2011 was 29.18%.[8] Pulwama has a sex ratio of 912 females for every 1000 males[8] (though this varies with religion), and is lower than the national average of 940, and a literacy rate of 64.3%.[8]
Pulwama district: mother-tongue of population, according to the 2011 Census.[12]
| Pulwama district: religion, gender ratio, and % urban of population, according to the 2011 Census.[11] | |||||||||
|---|---|---|---|---|---|---|---|---|---|
| Hindu | Muslim | Christian | Sikh | Buddhist | Jain | Other | Not stated | Total | |
| Total | 13,840 | 535,159 | 1,109 | 9,440 | 35 | 6 | 18 | 833 | 560,440 |
| 2.47% | 95.49% | 0.20% | 1.68% | 0.01% | 0.00% | 0.00% | 0.15% | 100.00% | |
| Male | 12,515 | 274,104 | 818 | 5,111 | 26 | 4 | 10 | 476 | 293,064 |
| Female | 1,325 | 261,055 | 291 | 4,329 | 9 | 2 | 8 | 357 | 267,376 |
| Gender ratio (% female) | 9.6% | 48.8% | 26.2% | 45.9% | 25.7% | 33.3% | 44.4% | 42.9% | 47.7% |
| Sex ratio (no. of females per 1,000 males) |
106 | 952 | 356 | 847 | – | – | – | 750 | 912 |
| Urban | 7,388 | 72,353 | 223 | 364 | 12 | 3 | 4 | 115 | 80,462 |
| Rural | 6,452 | 462,806 | 886 | 9,076 | 23 | 3 | 14 | 718 | 479,978 |
| % Urban | 53.4% | 13.5% | 20.1% | 3.9% | 34.3% | 50.0% | 22.2% | 13.8% | 14.4% |
| Pulwama district: mother-tongue of population, according to the 2011 Census.[12] | |||
|---|---|---|---|
| Mother tongue code | Mother tongue | People | Percentage |
| 001002 | Assamese | 554 | 0.10% |
| 002007 | Bengali | 988 | 0.18% |
| 004001 | Dogri | 343 | 0.06% |
| 005018 | Gujarati | 191 | 0.03% |
| 006102 | Bhojpuri | 154 | 0.03% |
| 006207 | Gojri/Gujjari/Gujar | 22,189 | 3.96% |
| 006235 | Haryanvi | 109 | 0.02% |
| 006240 | Hindi | 6,978 | 1.25% |
| 006340 | Kumauni | 234 | 0.04% |
| 006439 | Pahari | 3,811 | 0.68% |
| 006489 | Rajasthani | 93 | 0.02% |
| 007016 | Kannada | 436 | 0.08% |
| 008005 | Kashmiri | 511,681 | 91.30% |
| 011016 | Malayalam | 332 | 0.06% |
| 012003 | Manipuri | 195 | 0.03% |
| 013071 | Marathi | 665 | 0.12% |
| 014011 | Nepali | 40 | 0.01% |
| 015043 | Odia | 437 | 0.08% |
| 016038 | Punjabi | 7,728 | 1.38% |
| 020027 | Tamil | 643 | 0.11% |
| 021046 | Telugu | 609 | 0.11% |
| 022015 | Urdu | 443 | 0.08% |
| 024001 | Afghani/Kabuli/Pashto | 72 | 0.01% |
| 053005 | Gujari | 981 | 0.18% |
| 073003 | Ladakhi | 30 | 0.01% |
| 082005 | Lushai/Mizo | 85 | 0.02% |
| – | Others | 419 | 0.07% |
| Total | 560,440 | 100.00% | |
Land use
The "reporting area" is the area for which data on land use classification are available. When Pulwama district was created in 1979 it had a "reporting area" of 380 square miles (980 km2).[5] After the creation of Shopian district in 2007, the "reporting area" of Pulwama district was reduced to 240 square miles (610 km2).[5]
| Classification of use | Area in 2016–2017[13] | % total area | |
|---|---|---|---|
| sq miles | sq km | ||
| Forests | 1.6 | 4 | 0.4% |
| Area under non-agricultural uses (roads, railways, buildings, rivers, canals) | 32.4 | 84 | 8% |
| Barren and un-culturable land (mountains, deserts, etc.) | 9.8 | 25 | 2% |
| Permanent pastures and other grazing lands | 23.0 | 60 | 5% |
| Land under miscellaneous tree crops, etc. | 4.3 | 11 | 1% |
| Culturable waste land (land that could be cultivated, that has not been cultivated in the last five years) | 14.0 | 36 | 3% |
| Fallow lands other than current fallows (fallow for more than one year, which had been cultivated with the past five years) | 0.7 | 2 | 0.2% |
| Current fallows (fallow this year, but cultivated the previous year) | 24.6 | 64 | 6% |
| Net area sown (the total area sown with crops and orchards) | 124.7 | 323 | 30% |
| Reporting area | 234.6 | 608 | 56% |
| No data | 186.1 | 482 | 44% |
| Total area[1] | 420.9 | 1,090 | 100% |
| Definitions of land use classifications are given at: "Nine-fold classification of Land Use", Ministry of Statistics and Programme Implementation, Government of India, retrieved 22 July 2020 | |||
References
- "About District", Pulwama District, Government of Jammu and Kashmir, retrieved 22 July 2020
- Jasbir Singh (2004). The economy of Jammu & Kashmir. Radha Krishan Anand & Co. ISBN 9788188256099. Retrieved 2 December 2010.
The original name of Pulwama was Panwangam, which comprised four local namely, Malikpora, Dangerpora, Chatapora, Dalipora.
- Parvéz Dewân (2004). Parvéz Dewân's Jammû, Kashmîr, and Ladâkh: Kashmîr. Manas Publications. ISBN 9788170491798. Retrieved 2 December 2010.
The original name of Pulwama city(from which the district takes its name) was Panwangam. Over the centuries it got shortened to Pulgam. This in turn gradually changed to Pulwama.
- "About District/", District Anantnag, Government of Jammu and Kashmir, retrieved 23 July 2020
- "District background". Pulwama District, Government of Jammu and Kashmir. Archived from the original on 28 May 2014. Retrieved 17 December 2014.
- "About District/ Administrative Setup/ Tehsil", Pulwama District, Government of Jammu and Kashmir, retrieved 22 July 2020
- Statement showing the number of blocks in respect of 22 Districts of Jammu and Kashmir State including newly Created Districts Archived 2008-09-10 at the Wayback Machine dated 2008-03-13, accessed 2008-08-30
- "District Census 2011". Census2011.co.in. 2011. Retrieved 30 September 2011.
- US Directorate of Intelligence. "Country Comparison:Population". Retrieved 1 October 2011.
Solomon Islands 571,890 July 2011 est.
- "2010 Resident Population Data". U. S. Census Bureau. Retrieved 30 September 2011.
Wyoming 563,626
- C-1 Population By Religious Community – Jammu & Kashmir (Report). Office of the Registrar General & Census Commissioner, India. Retrieved 28 July 2020.
- C-16 Population By Mother Tongue – Jammu & Kashmir (Report). Office of the Registrar General & Census Commissioner, India. Retrieved 18 July 2020.
- "Demography", Pulwama District, Government of Jammu and Kashmir, retrieved 22 July 2020
Note that this is marked square kilometres, but the numbers are actually hectares.
External links
Places adjacent to Pulwama district | ||||||||||
|---|---|---|---|---|---|---|---|---|---|---|
| ||||||||||