Clark County, Missouri
Clark County is a county located in the U.S. state of Missouri. As of the 2010 census, the county's population was 7,139.[1] Its county seat is Kahoka.[2] The county was organized December 16, 1836 and named for William Clark, leader of the Lewis and Clark Expedition and later Governor of Missouri Territory.[3][4]
Clark County | |
|---|---|
 Clark County Courthouse in Kahoka | |
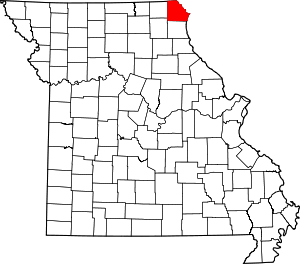 Location within the U.S. state of Missouri | |
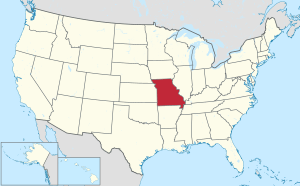 Missouri's location within the U.S. | |
| Coordinates: 40°25′N 91°44′W | |
| Country | |
| State | |
| Founded | December 16, 1836 |
| Named for | William Clark |
| Seat | Kahoka |
| Largest city | Kahoka |
| Area | |
| • Total | 512 sq mi (1,330 km2) |
| • Land | 505 sq mi (1,310 km2) |
| • Water | 7.1 sq mi (18 km2) 1.4% |
| Population (2010) | |
| • Total | 7,139 |
| • Estimate (2018) | 6,842 |
| • Density | 14/sq mi (5.4/km2) |
| Time zone | UTC−6 (Central) |
| • Summer (DST) | UTC−5 (CDT) |
| Congressional district | 6th |


Clark County is part of the Fort Madison–Keokuk, IA-IL-MO Micropolitan Statistical Area.
History
Missouri folklorist Margot Ford McMillen wrote that early settlers were attracted by Clark County's good and inexpensive agricultural land. One section was called "Bit Nation" because land was sold there for just twelve and one-half cents ("one bit" of a Spanish dollar) an acre.[5]
Geography
According to the U.S. Census Bureau, the county has a total area of 512 square miles (1,330 km2), of which 505 square miles (1,310 km2) is land and 7.1 square miles (18 km2) (1.4%) is water.[6]
Adjacent counties
- Van Buren County, Iowa (north)
- Lee County, Iowa (northeast)
- Hancock County, Illinois (east)
- Lewis County (south)
- Knox County (southwest)
- Scotland County (west)
Major highways


National protected area
Demographics
| Historical population | |||
|---|---|---|---|
| Census | Pop. | %± | |
| 1840 | 2,846 | — | |
| 1850 | 5,527 | 94.2% | |
| 1860 | 11,684 | 111.4% | |
| 1870 | 13,667 | 17.0% | |
| 1880 | 15,031 | 10.0% | |
| 1890 | 15,126 | 0.6% | |
| 1900 | 15,383 | 1.7% | |
| 1910 | 12,811 | −16.7% | |
| 1920 | 11,874 | −7.3% | |
| 1930 | 10,254 | −13.6% | |
| 1940 | 10,166 | −0.9% | |
| 1950 | 9,003 | −11.4% | |
| 1960 | 8,725 | −3.1% | |
| 1970 | 8,260 | −5.3% | |
| 1980 | 8,493 | 2.8% | |
| 1990 | 7,547 | −11.1% | |
| 2000 | 7,416 | −1.7% | |
| 2010 | 7,139 | −3.7% | |
| Est. 2018 | 6,842 | [7] | −4.2% |
| U.S. Decennial Census[8] 1790-1960[9] 1900-1990[10] 1990-2000[11] 2010-2015[1] | |||
As of the census[12] of 2010, there were 7,139 people, 2,966 households, and 2,079 families residing in the county. The population density was 15 people per square mile (6/km²). There were 3,483 housing units at an average density of 7 per square mile (3/km²). The racial makeup of the county was 98.83% White, 0.07% Black or African American, 0.20% Native American, 0.07% Asian, 0.01% Pacific Islander, 0.22% from other races, and 0.61% from two or more races. Approximately 0.70% of the population were Hispanic or Latino of any race.
There were 2,966 households out of which 30.30% had children under the age of 18 living with them, 58.70% were married couples living together, 7.00% had a female householder with no husband present, and 29.90% were non-families. 26.40% of all households were made up of individuals and 13.60% had someone living alone who was 65 years of age or older. The average household size was 2.46 and the average family size was 2.95.
In the county, the population was spread out with 25.00% under the age of 18, 7.80% from 18 to 24, 25.50% from 25 to 44, 25.00% from 45 to 64, and 16.70% who were 65 years of age or older. The median age was 39 years. For every 100 females, there were 97.60 males. For every 100 females age 18 and over, there were 94.00 males.
The median income for a household in the county was $29,457, and the median income for a family was $36,270. Males had a median income of $27,279 versus $19,917 for females. The per capita income for the county was $15,988. About 10.80% of families and 14.10% of the population were below the poverty line, including 19.70% of those under age 18 and 12.70% of those age 65 or over.
Education
Public schools
- Clark County R-I School District – Kahoka
- Running Fox Elementary School (PK-05)
- Black Hawk Elementary School (K-05)
- Clark County Middle School (06-08)
- Clark County High School (09-12)
- Luray School District No. 33 – Luray
- Luray Elementary School (PK-08)
Private schools
- Shiloh Christian School – Kahoka (03-12) – Nondenominational Christianity
Public libraries
- Northeast Missouri Library Service[13]
Politics
Local
The Republican Party controls politics at the local level in Clark County. As of 2018, Republicans hold nine of fourteen of the elected positions in the county.
| Clark County, Missouri | ||||
|---|---|---|---|---|
| Elected countywide officials | ||||
| Assessor | Donna F. Oilar | Democratic | ||
| Circuit Clerk | Mary D. Jones | Democratic | ||
| County Clerk | Leih Ann Hayden | Republican | ||
| Collector | Michelle Allen | Republican | ||
| Commissioner (Presiding) |
Ron Brewer | Republican | ||
| Commissioner (District 1) |
Jerry Neyens | Democratic | ||
| Commissioner (District 2) |
Roger Sedore | Democratic | ||
| Coroner | Edwin Wilson | Republican | ||
| Prosecuting Attorney | John Moon | Democratic | ||
| Public Administrator | Linda Shoup | Republican | ||
| Recorder | Mary D. Jones | Democratic | ||
| Sheriff | Paul Gaudette | Republican | ||
| Surveyor | Patrick Poepping | Republican | ||
| Treasurer | Roberta McAfee | Republican | ||
State
| Year | Republican | Democratic | Third Parties |
|---|---|---|---|
| 2016 | 62.34% 2,053 | 34.74% 1,144 | 2.92% 96 |
| 2012 | 40.78% 1,312 | 56.64% 1,822 | 2.58% 83 |
| 2008 | 51.33 % 1,772 | 46.00% 1,588 | 1.67% 92 |
| 2004 | 66.98% 2,469 | 30.63% 1,129 | 2.38% 88 |
| 2000 | 46.47% 1,751 | 51.17% 1,928 | 2.36% 89 |
| 1996 | 29.87% 966 | 68.46% 2,214 | 1.67% 54 |
All of Clark County is included in Missouri's 4th District in the Missouri House of Representatives and is represented by Craig Redmon (R-Canton).
| Party | Candidate | Votes | % | ± | |
|---|---|---|---|---|---|
| Republican | Craig Redmon | 2,818 | 100.00% | ||
| Party | Candidate | Votes | % | ± | |
|---|---|---|---|---|---|
| Republican | Craig Redmon | 1,794 | 100.00% | ||
| Party | Candidate | Votes | % | ± | |
|---|---|---|---|---|---|
| Republican | Craig Redmon | 2.582 | 100.00% | ||
All of Clark County is a part of Missouri's 18th District in the Missouri Senate and is currently represented by Brian Munzlinger (R-Williamstown).
| Party | Candidate | Votes | % | ± | |
|---|---|---|---|---|---|
| Republican | Brian Munzlinger | 1,837 | 100.00% | ||
Federal
| Party | Candidate | Votes | % | ± | |
|---|---|---|---|---|---|
| Republican | Roy Blunt | 2,037 | 62.16% | +22.17 | |
| Democratic | Jason Kander | 1,059 | 32.32% | -23.90 | |
| Libertarian | Jonathan Dine | 98 | 2.99% | -0.80 | |
| Green | Johnathan McFarland | 40 | 1.22% | +1.22 | |
| Constitution | Fred Ryman | 43 | 1.31% | +1.31 | |
| Party | Candidate | Votes | % | ± | |
|---|---|---|---|---|---|
| Republican | Todd Akin | 1.288 | 39.99% | ||
| Democratic | Claire McCaskill | 1,811 | 56.22% | ||
| Libertarian | Jonathan Dine | 122 | 3.79% | ||
All of Clark County is included in Missouri's 6th Congressional District and is currently represented by Sam Graves (R-Tarkio) in the U.S. House of Representatives.
| Party | Candidate | Votes | % | ± | |
|---|---|---|---|---|---|
| Republican | Sam Graves | 2,413 | 75.24% | +3.79 | |
| Democratic | David M. Blackwell | 673 | 20.99% | -4.49 | |
| Libertarian | Russ Lee Monchil | 68 | 2.12% | -0.95 | |
| Green | Mike Diel | 53 | 1.65% | +1.65 | |
| Party | Candidate | Votes | % | ± | |
|---|---|---|---|---|---|
| Republican | Sam Graves | 1,464 | 71.45% | +13.75 | |
| Democratic | Bill Hedge | 522 | 25.48% | -13.91 | |
| Libertarian | Russ Lee Monchil | 63 | 3.07% | +0.16 | |
| Party | Candidate | Votes | % | ± | |
|---|---|---|---|---|---|
| Republican | Sam Graves | 1,746 | 57.70% | ||
| Democratic | Kyle Yarber | 1,192 | 39.39% | ||
| Libertarian | Russ Lee Monchil | 88 | 2.91% | ||
| Year | Republican | Democratic | Third parties |
|---|---|---|---|
| 2016 | 74.1% 2,458 | 21.8% 724 | 4.0% 134 |
| 2012 | 53.6% 1,730 | 43.4% 1,398 | 3.0% 97 |
| 2008 | 51.6% 1,782 | 45.5% 1,572 | 3.0% 102 |
| 2004 | 50.8% 1,899 | 48.0% 1,794 | 1.2% 43 |
| 2000 | 50.0% 1,899 | 47.7% 1,812 | 2.4% 91 |
| 1996 | 32.6% 1,081 | 52.8% 1,749 | 14.6% 483 |
| 1992 | 29.0% 1,039 | 50.6% 1,815 | 20.4% 730 |
| 1988 | 43.5% 1,493 | 56.1% 1,925 | 0.4% 13 |
| 1984 | 56.0% 2,068 | 44.0% 1,627 | |
| 1980 | 56.5% 2,042 | 41.3% 1,494 | 2.2% 78 |
| 1976 | 48.3% 1,582 | 51.3% 1,679 | 0.4% 13 |
| 1972 | 64.0% 2,499 | 36.0% 1,403 | |
| 1968 | 53.6% 2,111 | 37.8% 1,489 | 8.7% 342 |
| 1964 | 42.8% 1,660 | 57.3% 2,223 | |
| 1960 | 56.4% 2,642 | 43.6% 2,039 | |
| 1956 | 54.5% 2,623 | 45.5% 2,193 | |
| 1952 | 58.0% 2,850 | 41.6% 2,045 | 0.5% 23 |
| 1948 | 49.0% 2,264 | 50.9% 2,352 | 0.1% 3 |
| 1944 | 55.6% 2,707 | 44.3% 2,155 | 0.1% 6 |
| 1940 | 53.6% 3,171 | 46.1% 2,728 | 0.3% 18 |
| 1936 | 48.2% 2,812 | 51.4% 3,003 | 0.4% 25 |
| 1932 | 41.8% 2,223 | 57.7% 3,072 | 0.5% 29 |
| 1928 | 59.8% 3,259 | 39.8% 2,170 | 0.3% 18 |
| 1924 | 50.4% 2,948 | 47.3% 2,770 | 2.3% 135 |
| 1920 | 57.5% 3,310 | 41.4% 2,383 | 1.2% 68 |
| 1916 | 50.7% 1,782 | 48.1% 1,692 | 1.2% 42 |
| 1912 | 36.5% 1,214 | 47.7% 1,586 | 15.7% 523 |
| 1908 | 49.5% 1,741 | 49.4% 1,737 | 1.1% 38 |
| 1904 | 50.5% 1,836 | 47.4% 1,724 | 2.1% 76 |
| 1900 | 47.7% 1,899 | 50.8% 2,021 | 1.5% 61 |
| 1896 | 47.9% 1,953 | 51.7% 2,107 | 0.4% 18 |
| 1892 | 47.5% 1,684 | 50.9% 1,807 | 1.6% 56 |
| 1888 | 48.5% 1,724 | 50.4% 1,791 | 1.0% 37 |
2008 U.S. presidential primary
- Former U.S. Senator Hillary Clinton (D-New York) received more votes, a total of 554, than any other candidate from either party in Clark County during the 2008 presidential primary.
| Clark County, Missouri | |
|---|---|
| 2008 Republican primary in Missouri | |
| John McCain | 195 (30.37%) |
| Mike Huckabee | 283 (44.08%) |
| Mitt Romney | 121 (18.85%) |
| Ron Paul | 28 (4.36%) |
| Clark County, Missouri | |
|---|---|
| 2008 Democratic primary in Missouri | |
| Hillary Clinton | 554 (63.90%) |
| Barack Obama | 264 (30.45%) |
| John Edwards (withdrawn) | 35 (4.04%) |
| Uncommitted | 8 (0.92%) |
Communities
Cities
- Alexandria
- Kahoka (county seat)
- Wayland
- Wyaconda
Census-designated place
Other unincorporated places
Townships (all inactive)
References
- "State & County QuickFacts". United States Census Bureau. Archived from the original on July 8, 2011. Retrieved September 7, 2013.
- "Find a County". National Association of Counties. Archived from the original on 2011-05-31. Retrieved 2011-06-07.
- Eaton, David Wolfe (1916). How Missouri Counties, Towns and Streams Were Named. The State Historical Society of Missouri. pp. 275.
- Gannett, Henry (1905). The Origin of Certain Place Names in the United States. Govt. Print. Off. pp. 82.
- McMillen, Margot Ford (1994). Paris, Tightwad and Peculiar: Missouri Place Names. Columbia, Missouri: University of Missouri Press. p. 46. ISBN 0-8262-0972-6.
- "2010 Census Gazetteer Files". United States Census Bureau. August 22, 2012. Archived from the original on October 21, 2013. Retrieved November 14, 2014.
- "Population and Housing Unit Estimates". Retrieved November 29, 2019.
- "U.S. Decennial Census". United States Census Bureau. Retrieved November 14, 2014.
- "Historical Census Browser". University of Virginia Library. Retrieved November 14, 2014.
- "Population of Counties by Decennial Census: 1900 to 1990". United States Census Bureau. Retrieved November 14, 2014.
- "Census 2000 PHC-T-4. Ranking Tables for Counties: 1990 and 2000" (PDF). United States Census Bureau. Retrieved November 14, 2014.
- "U.S. Census website". United States Census Bureau. Retrieved 2011-05-14.
- Breeding, Marshall. "Northeast Missouri Library Service". Libraries.org. Retrieved May 8, 2017.
- Leip, David. "Dave Leip's Atlas of U.S. Presidential Elections". uselectionatlas.org. Retrieved 2018-03-24.
External links
- "Guide to Clark County Missouri" records
- Digitized 1930 Plat Book of Clark County from University of Missouri Division of Special Collections, Archives, and Rare Books
Places adjacent to Clark County, Missouri | ||||||||||
|---|---|---|---|---|---|---|---|---|---|---|
| ||||||||||
Municipalities and communities of Clark County, Missouri, United States | ||
|---|---|---|
| Cities | Map of Missouri highlighting Clark County | |
| Villages | ||
| Townships | ||
| CDP | ||
| Other unincorporated communities | ||
| Authority control |
|
|---|