Tropical cyclones in 2014
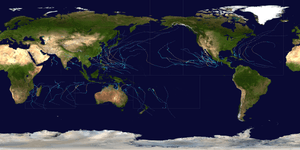
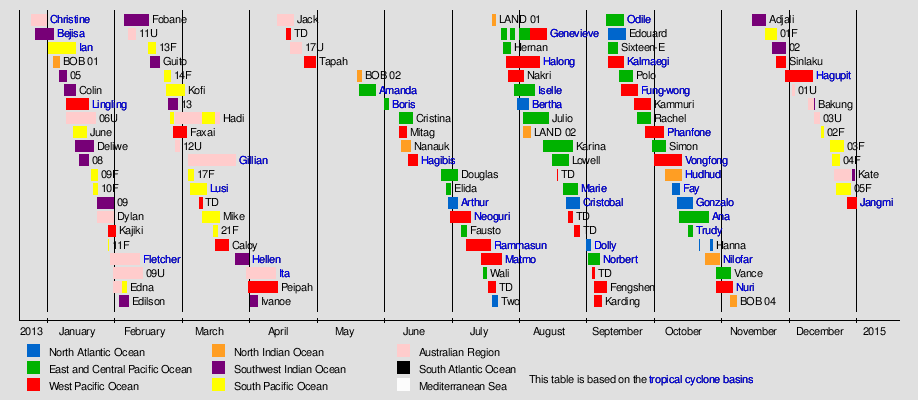
During 2014, tropical cyclones formed within seven different tropical cyclone basins, located within various parts of the Atlantic, Pacific and Indian Oceans. During the year, a total of 119 tropical cyclones had formed this year to date. 82 tropical cyclones had been named by either a Regional Specialized Meteorological Center (RSMC) or a Tropical Cyclone Warning Center (TCWC). The most active basin in 2014 was the Western Pacific, which documented 23 named systems, while the Eastern Pacific, despite only amounting to 22 named systems, was its basin's most active since 1992. Conversely, both the North Atlantic hurricane and North Indian Ocean cyclone seasons experienced the fewest cyclones reaching tropical storm intensity in recorded history, numbering 9 and 3, respectively. Activity across the southern hemisphere's three basins—South-West Indian, Australian, and South Pacific—was spread evenly, with each region recording seven named storms apiece.
| Tropical cyclones in 2014 | |
|---|---|
 Year summary map | |
| Year boundaries | |
| First system | Christine |
| Formed | December 25, 2013 |
| Last system | Jangmi |
| Dissipated | January 1, 2015 |
| Strongest system | |
| Name | Vongfong |
| Lowest pressure | 900 mbar/hPa; 26.58 inHg |
| Longest lasting system | |
| Name | Genevieve |
| Duration | 20 days |
| Year statistics | |
| Total systems | 119 |
| Named systems | 82 |
| Total fatalities | 870 total |
| Total damage | $18.94 billion (2014 USD) |
The strongest of these tropical cyclones was Typhoon Vongfong, which strengthened to a minimum barometric pressure of 900 mbar (hPa; 26.58 inHg) before striking the east coast of Japan. The costliest and deadliest tropical cyclone in 2014 was Typhoon Rammasun, which struck China in July, causing US$8.08 billion in damage. Rammasun killed 222 people; 106 in Philippines, 88 in China and 28 in Vietnam.
Global atmospheric and hydrological conditions
North Atlantic Ocean
Eastern Pacific Ocean
Summary

Systems
A total of 114 systems formed globally in 2014 with 71 of them causing significant damage, deaths, and/or setting records for their basin.
January
| Storm Name | Dates Active | Max wind mph (km/h) | Min pressure (mbar) | Areas Affected | Damage (USD) | Deaths | Refs |
|---|---|---|---|---|---|---|---|
February
| Storm Name | Dates Active | Max wind mph (km/h) | Min pressure (mbar) | Areas Affected | Damage (USD) | Deaths | Refs |
|---|---|---|---|---|---|---|---|
March
| Storm Name | Dates Active | Max wind mph (km/h) | Min pressure (mbar) | Areas Affected | Damage (USD) | Deaths | Refs |
|---|---|---|---|---|---|---|---|
April
| Storm Name | Dates Active | Max wind mph (km/h) | Min pressure (mbar) | Areas Affected | Damage (USD) | Deaths | Refs |
|---|---|---|---|---|---|---|---|
May
| Storm Name | Dates Active | Max wind mph (km/h) | Min pressure (mbar) | Areas Affected | Damage (USD) | Deaths | Refs |
|---|---|---|---|---|---|---|---|
June
| Storm Name | Dates Active | Max wind mph (km/h) | Min pressure (mbar) | Areas Affected | Damage (USD) | Deaths | Refs |
|---|---|---|---|---|---|---|---|
July
| Storm Name | Dates Active | Max wind mph (km/h) | Min pressure (mbar) | Areas Affected | Damage (USD) | Deaths | Refs |
|---|---|---|---|---|---|---|---|
August
| Storm Name | Dates Active | Max wind mph (km/h) | Min pressure (mbar) | Areas Affected | Damage (USD) | Deaths | Refs |
|---|---|---|---|---|---|---|---|
September
| Storm Name | Dates Active | Max wind mph (km/h) | Min pressure (mbar) | Areas Affected | Damage (USD) | Deaths | Refs |
|---|---|---|---|---|---|---|---|
October
| Storm Name | Dates Active | Max wind mph (km/h) | Min pressure (mbar) | Areas Affected | Damage (USD) | Deaths | Refs |
|---|---|---|---|---|---|---|---|
November
| Storm Name | Dates Active | Max wind mph (km/h) | Min pressure (mbar) | Areas Affected | Damage (USD) | Deaths | Refs |
|---|---|---|---|---|---|---|---|
December
| Storm Name | Dates Active | Max wind mph (km/h) | Min pressure (mbar) | Areas Affected | Damage (USD) | Deaths | Refs |
|---|---|---|---|---|---|---|---|
Global effects
Notes
1 Only systems that formed either on or after January 1, 2014 are counted in the seasonal totals.
2 Only systems that formed either before or on December 31, 2014 are counted in the seasonal totals.
3 The wind speeds for this tropical cyclone/basin are based on the IMD Scale which uses 3-minute sustained winds.
4 The wind speeds for this tropical cyclone/basin are based on the Saffir Simpson Scale which uses 1-minute sustained winds.
5The wind speeds for this tropical cyclone are based on Météo-France which uses gust winds.
See also
- List of earthquakes in 2014
- Tornadoes of 2014
- 2014 Pacific typhoon season
- 2014 Pacific hurricane season
- 2014 Atlantic hurricane season
- 2014 North Indian Ocean cyclone season
- Australian region cyclone seasons: 2013–14, 2014–15
- South-West Indian Ocean cyclone seasons: 2013–14, 2014–15
- South Pacific cyclone seasons: 2013–14, 2014–15
References
External links
Regional Specialized Meteorological Centers
- US National Hurricane Center – North Atlantic, Eastern Pacific
- Central Pacific Hurricane Center – Central Pacific
- Japan Meteorological Agency – NW Pacific
- India Meteorological Department – Bay of Bengal and the Arabian Sea
- Météo-France – La Reunion – South Indian Ocean from 30°E to 90°E
- Fiji Meteorological Service – South Pacific west of 160°E, north of 25° S
Tropical Cyclone Warning Centers
- Meteorology, Climatology, and Geophysical Agency of Indonesia – South Indian Ocean from 90°E to 141°E, generally north of 10°S
- Australian Bureau of Meteorology (TCWC's Perth, Darwin & Brisbane) – South Indian Ocean & South Pacific Ocean from 90°E to 160°E, generally south of 10°S
- Papua New Guinea National Weather Service – South Pacific Ocean from 141°E to 160°E, generally north of 10°S
- Meteorological Service of New Zealand Limited – South Pacific west of 160°E, south of 25°S
![]()