Sheffield Hillsborough (UK Parliament constituency)
Sheffield Hillsborough was a Parliamentary constituency in the City of Sheffield. It was considered a safe Labour seat and was represented by Helen Jackson from 1992 to 2005. She did not stand again in the 2005 general election and was succeeded by Angela Smith.
| Sheffield Hillsborough | |
|---|---|
| Former County constituency for the House of Commons | |
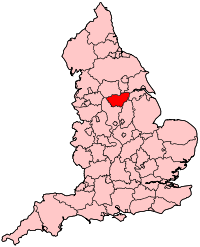
 Boundary of Sheffield Hillsborough in South Yorkshire for the 2005 general election | |
 Location of South Yorkshire within England | |
| County | South Yorkshire |
| 1918–2010 | |
| Replaced by | Sheffield Brightside and Hillsborough, Sheffield Hallam, Penistone and Stocksbridge |
| Created from | Sheffield Brightside and Sheffield Hallam |
The Sheffield Hillsborough constituency was abolished at the 2010 General Election. It was divided up and incorporated into the Sheffield Brightside and Hillsborough, Sheffield Hallam and Penistone and Stocksbridge constituencies.
Boundaries
1918–1950: The County Borough of Sheffield wards of Hillsborough, Neepsend, and Walkley.
1950–1955: The County Borough of Sheffield wards of Crookesmoor, Hillsborough, Owlerton, and Walkley.
1955–1974: The County Borough of Sheffield wards of Cathedral, Hillsborough, Owlerton, and Walkley.
1974–1983: The County Borough of Sheffield wards of Hillsborough, Netherthorpe, Owlerton, and Walkley.
1983–2010: The City of Sheffield wards of Chapel Green, Hillsborough, South Wortley, Stocksbridge, and Walkley.
The constituency covered north west Sheffield. It was named for Hillsborough and reached north west to Stocksbridge.
Members of Parliament
| Election | Member | Party | |
|---|---|---|---|
| 1918 | Arthur Neal | Coalition Liberal | |
| 1922 | A. V. Alexander | Labour Co-op | |
| 1931 | Gurney Braithwaite | Conservative | |
| 1935 | A. V. Alexander | Labour Co-op | |
| 1950 | George Darling | Labour Co-op | |
| Feb 1974 | Martin Flannery | Labour | |
| 1992 | Helen Jackson | Labour | |
| 2005 | Angela Smith | Labour | |
| 2010 | constituency abolished: see Sheffield Brightside and Hillsborough, Sheffield Hallam and Penistone and Stocksbridge | ||
Elections

Elections in the 2000s
| Party | Candidate | Votes | % | ± | |
|---|---|---|---|---|---|
| Labour | Angela Smith | 23,477 | 51.17 | -5.66 | |
| Liberal Democrats | John Commons | 12,234 | 26.66 | +4.09 | |
| Conservative | Jackie Doyle-Price | 6,890 | 15.02 | -3.32 | |
| BNP | David Wright | 2,010 | 4.38 | N/A | |
| UKIP | Maurice Patterson | 1,273 | 2.77 | +0.51 | |
| Majority | 11,243 | 24.51 | |||
| Turnout | 45,844 | 60.61 | |||
| Labour hold | Swing | -4.87 | |||
| Party | Candidate | Votes | % | ± | |
|---|---|---|---|---|---|
| Labour | Helen Jackson | 24,170 | 56.8 | -0.1 | |
| Liberal Democrats | John Commons | 9,601 | 22.6 | -3.3 | |
| Conservative | Graham King | 7,801 | 18.3 | +3.8 | |
| UKIP | Peter Webb | 964 | 2.3 | N/A | |
| Majority | 14,569 | 34.2 | |||
| Turnout | 42,536 | 57.3 | -13.7 | ||
| Labour hold | Swing | ||||
Elections in the 1990s
| Party | Candidate | Votes | % | ± | |
|---|---|---|---|---|---|
| Labour | Helen Jackson | 30,150 | 56.9 | ||
| Liberal Democrats | Arthur Dunworth | 13,699 | 25.8 | ||
| Conservative | David Nuttall | 7,707 | 14.5 | ||
| Referendum | John Rusling | 1,468 | 2.8 | ||
| Majority | 16,451 | 31.0 | |||
| Turnout | 53,024 | 71.0 | |||
| Labour hold | Swing | ||||
| Party | Candidate | Votes | % | ± | |
|---|---|---|---|---|---|
| Labour | Helen Jackson | 27,568 | 46.2 | ||
| Liberal Democrats | David Chadwick | 20,500 | 34.3 | ||
| Conservative | Sid Cordle | 11,640 | 19.5 | ||
| Majority | 7,068 | 11.8 | |||
| Turnout | 77.2 | ||||
| Labour hold | Swing | ||||
Elections in the 1980s
| Party | Candidate | Votes | % | ± | |
|---|---|---|---|---|---|
| Labour | Martin Flannery | 26,208 | 44.0 | ||
| Liberal | David Chadwick | 22,922 | 38.5 | ||
| Conservative | John Sykes | 10,396 | 17.5 | ||
| Majority | 3,286 | 5.5 | |||
| Turnout | 78.0 | ||||
| Labour hold | Swing | ||||
| Party | Candidate | Votes | % | ± | |
|---|---|---|---|---|---|
| Labour | Martin Flannery | 20,901 | 37.2 | ||
| Liberal | David Chadwick | 19,355 | 34.5 | ||
| Conservative | Christine Smith | 15,881 | 28.3 | ||
| Majority | 1,546 | 2.8 | |||
| Turnout | 75.4 | ||||
| Labour hold | Swing | ||||
Elections in the 1970s
| Party | Candidate | Votes | % | ± | |
|---|---|---|---|---|---|
| Labour | Martin Flannery | 20,556 | 56.8 | ||
| Conservative | Irvine Patnick | 12,206 | 33.7 | ||
| Liberal | P. A. Neale | 3,088 | 8.5 | ||
| National Front | S. Williams | 326 | 0.9 | ||
| Majority | 8,350 | 23.1 | |||
| Turnout | 70.8 | ||||
| Labour hold | Swing | ||||
| Party | Candidate | Votes | % | ± | |
|---|---|---|---|---|---|
| Labour | Martin Flannery | 21,026 | 60.7 | ||
| Conservative | Brian Williamson | 8,718 | 25.2 | ||
| Liberal | Robin Osner | 4,912 | 14.2 | ||
| Majority | 12,308 | 35.5 | |||
| Turnout | 66.6 | ||||
| Labour hold | Swing | ||||
| Party | Candidate | Votes | % | ± | |
|---|---|---|---|---|---|
| Labour | Martin Flannery | 22,065 | 55.6 | ||
| Conservative | Brian Williamson | 10,785 | 27.2 | ||
| Liberal | Robin Osner | 6,863 | 17.3 | ||
| Majority | 11,280 | 28.4 | |||
| Turnout | 76.8 | ||||
| Labour hold | Swing | ||||
| Party | Candidate | Votes | % | ± | |
|---|---|---|---|---|---|
| Labour Co-op | George Darling | 18,775 | 62.1 | ||
| Conservative | Irvine Patnick | 11,445 | 37.9 | ||
| Majority | 7,330 | 24.3 | |||
| Turnout | 65.0 | ||||
| Labour Co-op hold | Swing | ||||
Elections in the 1960s
| Party | Candidate | Votes | % | ± | |
|---|---|---|---|---|---|
| Labour Co-op | George Darling | 22,799 | 67.9 | ||
| Conservative | Michael J Mallett | 10,774 | 32.1 | ||
| Majority | 12,025 | 35.8 | |||
| Turnout | 70.3 | ||||
| Labour Co-op hold | Swing | ||||
| Party | Candidate | Votes | % | ± | |
|---|---|---|---|---|---|
| Labour Co-op | George Darling | 22,071 | 62.4 | ||
| Conservative | Robert James Lawther | 13,278 | 37.6 | ||
| Majority | 8,793 | 24.9 | |||
| Turnout | 74.5 | ||||
| Labour Co-op hold | Swing | ||||
Elections in the 1950s
| Party | Candidate | Votes | % | ± | |
|---|---|---|---|---|---|
| Labour Co-op | George Darling | 21,888 | 56.5 | ||
| Conservative and National Liberal | Stanley Kenneth Arnold | 16,845 | 43.5 | ||
| Majority | 5,043 | 13.0 | |||
| Turnout | 75.9 | ||||
| Labour Co-op hold | Swing | ||||
| Party | Candidate | Votes | % | ± | |
|---|---|---|---|---|---|
| Labour Co-op | George Darling | 23,438 | 58.8 | ||
| Conservative and National Liberal | Stanley Kenneth Arnold | 16,428 | 41.2 | ||
| Majority | 7,010 | 17.6 | |||
| Turnout | 73.0 | ||||
| Labour Co-op hold | Swing | ||||
| Party | Candidate | Votes | % | ± | |
|---|---|---|---|---|---|
| Labour Co-op | George Darling | 28,274 | 59.0 | +0.3 | |
| National Liberal and Conservative | George Wadsworth | 19,617 | 41.0 | +1.2 | |
| Majority | 8,657 | 18.0 | -0.9 | ||
| Turnout | 84.9 | -2.2 | |||
| Labour Co-op hold | Swing | -0.5 | |||
| Party | Candidate | Votes | % | ± | |
|---|---|---|---|---|---|
| Labour Co-op | George Darling | 28,295 | 58.7 | ||
| National Liberal and Conservative | Knowles Edge | 19,613 | 39.8 | ||
| Communist | Mick Bennett[10] | 759 | 1.5 | ||
| Majority | 9,312 | 18.9 | |||
| Turnout | 87.1 | ||||
| Labour Co-op hold | Swing | ||||
Elections in the 1940s
| Party | Candidate | Votes | % | ± | |
|---|---|---|---|---|---|
| Labour Co-op | A. V. Alexander | 24,959 | 63.4 | ||
| Liberal National | Robert Hobart | 14,403 | 36.6 | ||
| Majority | 10,556 | 26.8 | |||
| Turnout | 76.0 | ||||
| Labour Co-op hold | Swing | ||||
Elections in the 1930s
| Party | Candidate | Votes | % | ± | |
|---|---|---|---|---|---|
| Labour Co-op | A. V. Alexander | 21,025 | 54.3 | ||
| Conservative | Gurney Braithwaite | 17,721 | 45.7 | ||
| Majority | 3,304 | 8.6 | |||
| Turnout | 76.8 | ||||
| Labour Co-op gain from Conservative | Swing | ||||
| Party | Candidate | Votes | % | ± | |
|---|---|---|---|---|---|
| Conservative | Gurney Braithwaite | 23,819 | 57.9 | ||
| Labour Co-op | A. V. Alexander | 17,319 | 42.1 | ||
| Majority | 6,500 | 15.8 | |||
| Turnout | 81.6 | ||||
| Conservative gain from Labour Co-op | Swing | ||||
Elections in the 1920s
| Party | Candidate | Votes | % | ± | |
|---|---|---|---|---|---|
| Labour Co-op | A. V. Alexander | 20,941 | 57.3 | +0.4 | |
| Unionist | Albert Harland | 10,489 | 28.8 | -14.3 | |
| Liberal | Edward Hugh Frederick Morris | 5,053 | 13.9 | n/a | |
| Majority | 10,452 | 28.5 | +14.7 | ||
| Turnout | 77.6 | -0.3 | |||
| Labour Co-op hold | Swing | +7.3 | |||
| Party | Candidate | Votes | % | ± | |
|---|---|---|---|---|---|
| Labour Co-op | A. V. Alexander | 16,573 | 56.9 | ||
| Conservative | Norman Graham Thwaites | 12,554 | 43.1 | ||
| Majority | 4,019 | 13.8 | |||
| Turnout | 77.9 | ||||
| Labour Co-op hold | Swing | ||||
| Party | Candidate | Votes | % | ± | |
|---|---|---|---|---|---|
| Labour Co-op | A. V. Alexander | 15,087 | 55.7 | -0.5 | |
| Unionist | Charles Boot | 8,369 | 30.9 | n/a | |
| Liberal | Ernest Woodhead | 3,636 | 13.4 | n/a | |
| Majority | 6,718 | 24.8 | +12.4 | ||
| Turnout | 73.3 | -1.4 | |||
| Labour Co-op hold | Swing | n/a | |||
| Party | Candidate | Votes | % | ± | |
|---|---|---|---|---|---|
| Labour Co-op | A. V. Alexander | 15,130 | 56.2 | ||
| National Liberal | Arthur Neal | 11,812 | 43.8 | ||
| Majority | 3,318 | 12.4 | |||
| Turnout | 74.7 | ||||
| Labour Co-op gain from Liberal | Swing | ||||
Elections in the 1910s

| Party | Candidate | Votes | % | ± | |
|---|---|---|---|---|---|
| C | Liberal | Arthur Neal | 11,171 | 73.4 | n/a |
| Co-operative Party | Arthur Lockwood | 4,050 | 26.6 | n/a | |
| Majority | 7,121 | 46.8 | n/a | ||
| Turnout | 42.2 | n/a | |||
| Liberal win (new seat) | |||||
| C indicates candidate endorsed by the coalition government. | |||||
References
- "Election Data 2005". Electoral Calculus. Archived from the original on 15 October 2011. Retrieved 18 October 2015.
- "Election Data 2001". Electoral Calculus. Archived from the original on 15 October 2011. Retrieved 18 October 2015.
- "Election Data 1997". Electoral Calculus. Archived from the original on 15 October 2011. Retrieved 18 October 2015.
- "Election Data 1992". Electoral Calculus. Archived from the original on 15 October 2011. Retrieved 18 October 2015.
- "Election Data 1987". Electoral Calculus. Archived from the original on 15 October 2011. Retrieved 18 October 2015.
- "Election Data 1983". Electoral Calculus. Archived from the original on 15 October 2011. Retrieved 18 October 2015.
- Stevenson, Graham. "Bennett, Mick". Retrieved 29 April 2017.
Sources
- BBC Election 2005
- BBC Vote 2001
- Guardian Unlimited Politics (Election results from 1992 to the present)
- Leigh Rayment's Historical List of MPs – Constituencies beginning with "H" (part 3)
- http://www.psr.keele.ac.uk/ (Election results from 1951 to the present)
- F. W. S. Craig, British Parliamentary Election Results 1918 - 1949
- F. W. S. Craig, British Parliamentary Election Results 1950 - 1970
- Sheffield General Election Results 1945 - 2001, Sheffield City Council