San Manuel, Tarlac
San Manuel, officially the Municipality of San Manuel (Ilocano: Ili ti San Manuel; Pangasinan: Baley na San Manuel; Kapampangan: Balen ning San Manuel), is a 4th class municipality in the province of Tarlac, Philippines. According to the 2015 census, it has a population of 25,504 people.[3]
San Manuel | |
|---|---|
| Municipality of San Manuel | |
Municipal Hall | |
 Seal | |
| Motto(s): Bangon pa, Sulong pa, San Manuel! | |
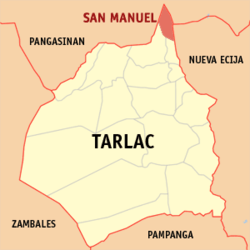
 Map of Tarlac with San Manuel highlighted | |
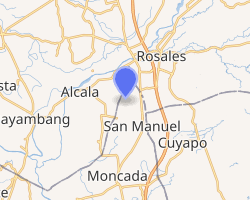
OpenStreetMap 
| |
.svg.png) San Manuel Location within the Philippines | |
| Coordinates: 15°50′N 120°35′E | |
| Country | |
| Region | Central Luzon (Region III) |
| Province | Tarlac |
| District | 1st District |
| Founded | February 25, 1909 |
| Barangays | 15 (see Barangays) |
| Government | |
| • Type | Sangguniang Bayan |
| • Mayor | Doña Cresencia R. Tesoro |
| • Vice Mayor | Benjamin D. Tesoro |
| • Congressman | Carlos O. Cojuangco |
| • Electorate | 16,750 voters (2019) |
| Area | |
| • Total | 42.10 km2 (16.25 sq mi) |
| Population (2015 census)[3] | |
| • Total | 25,504 |
| • Density | 610/km2 (1,600/sq mi) |
| • Households | 5,645 |
| Economy | |
| • Income class | 4th municipal income class |
| • Poverty incidence | 16.7% (2015)[4] |
| • Revenue (₱) | 202,598,445.47 (2016) |
| Time zone | UTC+8 (PST) |
| ZIP code | 2309 |
| PSGC | |
| IDD : area code | +63 (0)45 |
| Climate type | tropical monsoon climate |
| Native languages | Pangasinan Ilocano Tagalog Kapampangan |
| Website | www |
The town of San Manuel is a typically rural community located at the northernmost horn of the Province of Tarlac. Ilocano, Kapampangan and Pangasinan are commonly spoken, with Tagalog and English as official languages used for secondary education, business and governance. The municipality is known for their Buridibud (kind of vegetable stew) festival.
From Manila, the town is accessible via the MacArthur Highway, or via the NLEX (North Luzon Expressway) and TPLEX (Tarlac-Pangasinan-La Union Expressway); it is the last town of Tarlac before entering the town of Rosales in the province of Pangasinan.
History
When the barrio of San Jose was separated from the town of Moncada to be proclaimed a sister municipality in 1909, they renamed it “San Manuel” in honor of their benefactor, Don Manuel de Leon.
San Manuel was originally covered with dense forest, lakes and creeks. Wild animals roamed into the wilderness. Settlers from Zambales and Pangasinan and later those from the Ilocos region inhabited into the area to start a new life.
The residents of this barrio then did not know which jurisdiction they belonged. There are four towns surrounding the area namely: Moncada in the south; Anao and Cuyapo in the east and Alcala in the north. Neither of these duly organized municipalities claimed the sprawling area. However, an incident in the barrio helped the people solved the “jurisdiction” problem. A man gathering bees fell from the tree and died. The people immediately reported the incident to the nearby localities but only the Moncada authorities came and investigated the incident. Spurred by the gestures of the people of that town, they joined and submitted themselves under their jurisdiction and finally became an integral part of Moncada.
Geography
The Provinces of Pangasinan and Nueva Ecija border it on the north and east respectively, while on the southern side are the municipalities of Anao and Moncada.
San Manuel is 161 kilometres (100 mi) from Manila and is 37 kilometres (23 mi) from the provincial capital, Tarlac City.
Barangays
San Manuel is politically subdivided into 15 barangays. [2]
- Colubot
- Lanat
- Legaspi
- Mangandingay
- Matarannoc
- Pacpaco
- Poblacion
- Salcedo
- San Agustin
- San Felipe
- San Jacinto
- San Miguel
- San Narciso
- San Vicente
- Santa Maria
Climate
| Climate data for San Manuel, Tarlac | |||||||||||||
|---|---|---|---|---|---|---|---|---|---|---|---|---|---|
| Month | Jan | Feb | Mar | Apr | May | Jun | Jul | Aug | Sep | Oct | Nov | Dec | Year |
| Average high °C (°F) | 30 (86) |
31 (88) |
33 (91) |
34 (93) |
33 (91) |
31 (88) |
29 (84) |
29 (84) |
29 (84) |
30 (86) |
30 (86) |
29 (84) |
31 (87) |
| Average low °C (°F) | 19 (66) |
19 (66) |
20 (68) |
22 (72) |
24 (75) |
24 (75) |
24 (75) |
24 (75) |
24 (75) |
22 (72) |
21 (70) |
20 (68) |
22 (71) |
| Average precipitation mm (inches) | 5 (0.2) |
5 (0.2) |
10 (0.4) |
23 (0.9) |
136 (5.4) |
191 (7.5) |
245 (9.6) |
241 (9.5) |
200 (7.9) |
108 (4.3) |
36 (1.4) |
12 (0.5) |
1,212 (47.8) |
| Average rainy days | 2.6 | 2.5 | 4.4 | 8.3 | 20.9 | 24.4 | 27.4 | 26.9 | 25.0 | 18.2 | 9.2 | 3.6 | 173.4 |
| Source: Meteoblue [5] | |||||||||||||
Demographics
|
| ||||||||||||||||||||||||||||||||||||||||||
| Source: Philippine Statistics Authority[3][6][7][8] | |||||||||||||||||||||||||||||||||||||||||||
In the 2015 census, the population of San Manuel, Tarlac, was 25,504 people,[3] with a density of 610 inhabitants per square kilometre or 1,600 inhabitants per square mile.
References
- "Municipality". Quezon City, Philippines: Department of the Interior and Local Government. Retrieved 31 May 2013.
- "Province: Tarlac". PSGC Interactive. Quezon City, Philippines: Philippine Statistics Authority. Retrieved 12 November 2016.
- Census of Population (2015). "Region III (Central Luzon)". Total Population by Province, City, Municipality and Barangay. PSA. Retrieved 20 June 2016.
- "PSA releases the 2015 Municipal and City Level Poverty Estimates". Quezon City, Philippines. Retrieved 1 January 2020.
- "San Manuel: Average Temperatures and Rainfall". Meteoblue. Retrieved 5 May 2020.
- Census of Population and Housing (2010). "Region III (Central Luzon)". Total Population by Province, City, Municipality and Barangay. NSO. Retrieved 29 June 2016.
- Censuses of Population (1903–2007). "Region III (Central Luzon)". Table 1. Population Enumerated in Various Censuses by Province/Highly Urbanized City: 1903 to 2007. NSO.
- "Province of Tarlac". Municipality Population Data. Local Water Utilities Administration Research Division. Retrieved 17 December 2016.
External links
| Wikimedia Commons has media related to San Manuel, Tarlac. |