Santa Ignacia, Tarlac
Santa Ignacia, officially the Municipality of Santa Ignacia (Kapampangan: Balen ning Santa Ignacia; Pangasinan: Baley na Santa Ignacia; Ilocano: Ili ti Santa Ignacia; Tagalog: Bayan ng Santa Ignacia), is a 2nd class municipality in the province of Tarlac, Philippines. Santa Ignacia has a total land area of 14,607 hectares. It is composed of 24 barangays two of which (Poblacion East and Poblacion West) are located in the urban area while the rest of 22 barangays are located in the rural areas. According to the 2015 census, it has a population of 47,538 people.[3]
Santa Ignacia | |
|---|---|
| Municipality of Santa Ignacia | |
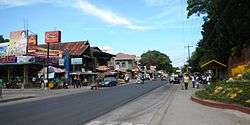
 Downtown area | |
 Seal | |
| Nickname(s): Nacia | |
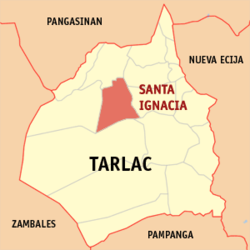
 Map of Tarlac with Santa Ignacia highlighted | |
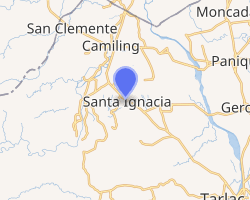
OpenStreetMap 
| |
.svg.png) Santa Ignacia Location within the Philippines | |
| Coordinates: 15°37′N 120°26′E | |
| Country | |
| Region | Central Luzon (Region III) |
| Province | Tarlac |
| District | 1st District |
| Barangays | 24 (see Barangays) |
| Government | |
| • Type | Sangguniang Bayan |
| • Mayor | Nora T. Modomo |
| • Vice Mayor | Nathaniel L. Tan |
| • Congressman | Carlos O. Cojuangco |
| • Electorate | 30,363 voters (2019) |
| Area | |
| • Total | 146.07 km2 (56.40 sq mi) |
| Population (2015 census)[3] | |
| • Total | 47,538 |
| • Density | 330/km2 (840/sq mi) |
| • Households | 11,454 |
| Economy | |
| • Income class | 2nd municipal income class |
| • Poverty incidence | 15.03% (2015)[4] |
| • Revenue (₱) | 120,330,708.03 (2016) |
| Time zone | UTC+8 (PST) |
| ZIP code | 2303 |
| PSGC | |
| IDD : area code | +63 (0)45 |
| Climate type | tropical monsoon climate |
| Native languages | Pangasinan Ilocano Tagalog Kapampangan |
| Website | santaignaciatarlac |
Climate
| Climate data for Santa Ignacia, Tarlac | |||||||||||||
|---|---|---|---|---|---|---|---|---|---|---|---|---|---|
| Month | Jan | Feb | Mar | Apr | May | Jun | Jul | Aug | Sep | Oct | Nov | Dec | Year |
| Average high °C (°F) | 30 (86) |
31 (88) |
33 (91) |
35 (95) |
33 (91) |
31 (88) |
30 (86) |
29 (84) |
29 (84) |
30 (86) |
31 (88) |
30 (86) |
31 (88) |
| Average low °C (°F) | 19 (66) |
19 (66) |
20 (68) |
22 (72) |
24 (75) |
24 (75) |
24 (75) |
24 (75) |
23 (73) |
22 (72) |
21 (70) |
20 (68) |
22 (71) |
| Average precipitation mm (inches) | 3 (0.1) |
2 (0.1) |
5 (0.2) |
10 (0.4) |
80 (3.1) |
107 (4.2) |
138 (5.4) |
147 (5.8) |
119 (4.7) |
70 (2.8) |
26 (1.0) |
8 (0.3) |
715 (28.1) |
| Average rainy days | 2.0 | 1.7 | 2.7 | 4.6 | 16.1 | 20.8 | 24.0 | 23.0 | 21.4 | 15.5 | 8.0 | 3.2 | 143 |
| Source: Meteoblue [5] | |||||||||||||
Demographics
| Year | Pop. | ±% p.a. |
|---|---|---|
| 1903 | 1,911 | — |
| 1918 | 5,382 | +7.15% |
| 1939 | 10,993 | +3.46% |
| 1948 | 14,061 | +2.77% |
| 1960 | 15,512 | +0.82% |
| 1970 | 20,775 | +2.96% |
| 1975 | 23,157 | +2.20% |
| 1980 | 25,224 | +1.72% |
| 1990 | 30,470 | +1.91% |
| 1995 | 34,658 | +2.44% |
| 2000 | 38,301 | +2.17% |
| 2007 | 43,560 | +1.79% |
| 2015 | 47,538 | +1.10% |
| Source: Philippine Statistics Authority[3][6][7][8] | ||
In the 2015 census, the population of Santa Ignacia, Tarlac, was 47,538 people,[3] with a density of 330 inhabitants per square kilometre or 850 inhabitants per square mile.
Gallery
- Our Lady of Fatima Parish Church of Santa Ignacia
- Town hall
- Town hall
gollark: No. For tax reasons, I do not currently operate with blood.
gollark: ÆÆÆÆÆÆÆÆÆÆÆÆÆÆÆÆ what is WRONG with this CODE⸘
gollark: It contains THINGS. Horrible things.
gollark: an dentistist vistitation
gollark: ?star stats
References
- "Municipality". Quezon City, Philippines: Department of the Interior and Local Government. Retrieved 31 May 2013.
- "Province: Tarlac". PSGC Interactive. Quezon City, Philippines: Philippine Statistics Authority. Retrieved 12 November 2016.
- Census of Population (2015). "Region III (Central Luzon)". Total Population by Province, City, Municipality and Barangay. PSA. Retrieved 20 June 2016.
- "PSA releases the 2015 Municipal and City Level Poverty Estimates". Quezon City, Philippines. Retrieved 1 January 2020.
- "Santa Ignacia: Average Temperatures and Rainfall". Meteoblue. Retrieved 5 May 2020.
- Census of Population and Housing (2010). "Region III (Central Luzon)". Total Population by Province, City, Municipality and Barangay. NSO. Retrieved 29 June 2016.
- Censuses of Population (1903–2007). "Region III (Central Luzon)". Table 1. Population Enumerated in Various Censuses by Province/Highly Urbanized City: 1903 to 2007. NSO.
- "Province of Tarlac". Municipality Population Data. Local Water Utilities Administration Research Division. Retrieved 17 December 2016.
External links
| Wikimedia Commons has media related to Santa Ignacia, Tarlac. |
- Santa Ignacia Profile at PhilAtlas.com
- Official website
- Town History
- Philippine Standard Geographic Code
- Philippine Census Information
This article is issued from Wikipedia. The text is licensed under Creative Commons - Attribution - Sharealike. Additional terms may apply for the media files.