New York's 27th congressional district
The 27th congressional district of New York is a congressional district for the United States House of Representatives in western New York. It includes all of Orleans, Genesee, Wyoming, and Livingston counties and parts of Erie, Monroe, Niagara, and Ontario counties. The district contains most of the eastern and southern suburbs of Buffalo, most of the southern suburbs of Rochester, as well as large rural areas to the east and south. The seat is currently occupied by Republican Chris Jacobs, who won a special election on June 23, 2020.[3][4] Previously, it had been vacant since October 1, 2019, when Republican incumbent Chris Collins resigned after pleading guilty to charges of insider trading.[5] It is considered the most Republican-leaning district in the state, with Donald Trump having won it by 24.5 points in 2016.
| New York's 27th congressional district | |||
|---|---|---|---|
.tif.png) New York's 27th congressional district since January 3, 2013 | |||
| Representative |
| ||
| Distribution |
| ||
| Population (2018 ACS est.) | 712,904 | ||
| Median income | $64,499[1] | ||
| Ethnicity |
| ||
| Cook PVI | R+11[2] | ||
Historical location
The precursor to the district was the central Erie county seat numbered the 30th district in the 1990s. In the 1980s this area was in the 33rd district. In the 1970s it was numbered the 37th district, although certain suburban areas were in the 38th district (later the 31st). None of these districts included the Jamestown area, which had always been in the southern tier district (now the 29th district) in prior maps.
The 27th district covered the area now in the 26th district in the 1990s and the Syracuse area (now the 25th district) in the 1980s. It was the Southern Tier seat now numbered the 22nd in the 1970s. In the 1960s this district was in the lower Hudson Valley covering the area now in the 19th district.
Recent election results in statewide races
| Year | Office | Results |
|---|---|---|
| 1992 | President | Bush 42–33% |
| 1996 | President | Clinton 43–43% |
| 2000 | President | Gore 53–41% |
| 2004 | President | Kerry 53–45% |
| 2008 | President | McCain 54–44% |
| 2012 | President | Romney 55.3–42.9% |
| 2016 | President | Trump 59.7–35.2% |
List of members representing the district and locations
| Member | Party | Years | Cong ress |
Electoral history | District location (counties) |
|---|---|---|---|---|---|
| District created | March 4, 1823 | District created | |||
| Moses Hayden | Democratic-Republican | March 4, 1823 – March 3, 1825 |
18th 19th |
Elected in 1822. Re-elected in 1824. [data unknown/missing] |
1823–1833 [data unknown/missing] |
| Anti-Jacksonian | March 4, 1825 – March 3, 1827 | ||||
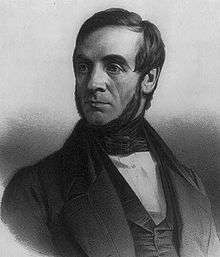 Daniel D. Barnard |
Anti-Jacksonian | March 4, 1827 – March 3, 1829 |
20th | Elected in 1826. Lost re-election. | |
| Timothy Childs | Anti-Masonic | March 4, 1829 – March 3, 1831 |
21st | [data unknown/missing] | |
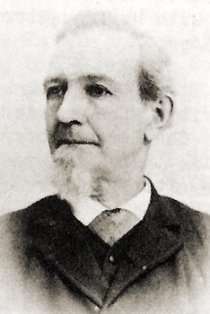 Frederick Whittlesey |
Anti-Masonic | March 4, 1831 – March 3, 1833 |
22nd | [data unknown/missing] Redistricted to the 28th district. | |
| Edward Howell | Jacksonian | March 4, 1833 – March 3, 1835 |
23rd | [data unknown/missing] | 1833–1843 [data unknown/missing] |
| Joshua Lee | Jacksonian | March 4, 1835 – March 3, 1837 |
24th | [data unknown/missing] | |
| John T. Andrews | Democratic | March 4, 1837 – March 3, 1839 |
25th | [data unknown/missing] | |
| Meredith Mallory | Democratic | March 4, 1839 – March 3, 1841 |
26th | [data unknown/missing] | |
| William M. Oliver | Democratic | March 4, 1841 – March 3, 1843 |
27th | [data unknown/missing] | |
| Byram Green | Democratic | March 4, 1843 – March 3, 1845 |
28th | [data unknown/missing] | 1843–1853 [data unknown/missing] |
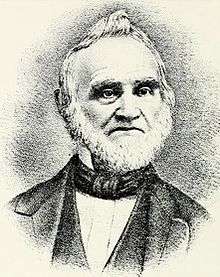 John De Mott |
Democratic | March 4, 1845 – March 3, 1847 |
29th | [data unknown/missing] | |
| John M. Holley | Whig | March 4, 1847 – March 8, 1848 |
30th | [data unknown/missing] Died. | |
| Vacant | March 8, 1848 – December 4, 1848 | ||||
| Esbon Blackmar | Whig | December 4, 1848 – March 3, 1849 |
Elected to finish Holley's term. [data unknown/missing] | ||
.jpg) William A. Sackett |
Whig | March 4, 1849 – March 3, 1853 |
31st 32nd |
[data unknown/missing] | |
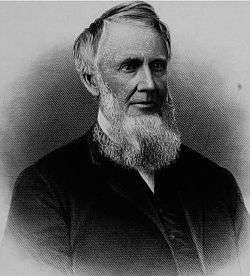 John J. Taylor |
Democratic | March 4, 1853 – March 3, 1855 |
33rd | [data unknown/missing] | 1853–1863 [data unknown/missing] |
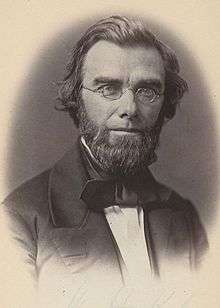 John Mason Parker |
Opposition | March 4, 1855 – March 3, 1857 |
34th 35th |
[data unknown/missing] | |
| Republican | March 4, 1857 – March 3, 1859 | ||||
| Alfred Wells | Republican | March 4, 1859 – March 3, 1861 |
36th | [data unknown/missing] | |
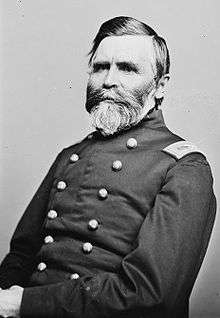 Alexander S. Diven |
Republican | March 4, 1861 – March 3, 1863 |
37th | [data unknown/missing] | |
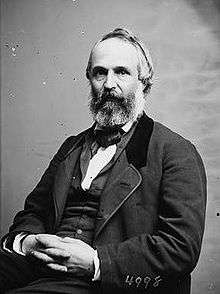 Robert B. Van Valkenburgh |
Republican | March 4, 1863 – March 3, 1865 |
38th | Redistricted from the 28th district and re-elected in 1862. [data unknown/missing] |
1863–1873 [data unknown/missing] |
 Hamilton Ward |
Republican | March 4, 1865 – March 3, 1871 |
39th 40th 41st |
[data unknown/missing] | |
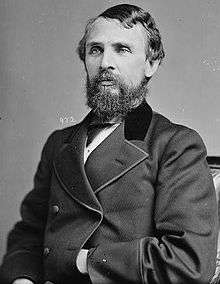 Horace B. Smith |
Republican | March 4, 1871 – March 3, 1873 |
42nd | [data unknown/missing] Redistricted to the 28th district. | |
 Thomas C. Platt |
Republican | March 4, 1873 – March 3, 1875 |
43rd | [data unknown/missing] Redistricted to the 28th district. |
1873–1883 [data unknown/missing] |
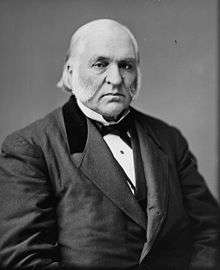 Elbridge G. Lapham |
Republican | March 4, 1875 – July 29, 1881 |
44th 45th 46th 47th |
[data unknown/missing] Resigned when elected to US Senate | |
| Vacant | July 30, 1881 – November 7, 1881 |
47th | |||
 James W. Wadsworth |
Republican | November 8, 1881 – March 3, 1885 |
47th 48th |
Elected to finish Lapham's term. [data unknown/missing] | |
| 1883–1893 [data unknown/missing] | |||||
 Sereno E. Payne |
Republican | March 4, 1885 – March 3, 1887 |
49th | Redistricted from the 26th district and re-elected in 1884. [data unknown/missing] | |
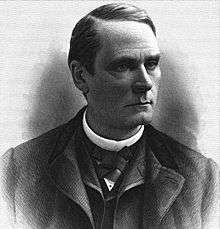 Newton W. Nutting |
Republican | March 4, 1887 – October 15, 1889 |
50th 51st |
[data unknown/missing] Died. | |
| Vacant | October 16, 1889 – December 2, 1889 |
51st | |||
 Sereno E. Payne |
Republican | December 2, 1889 – March 3, 1893 |
51st 52nd |
Elected to finish Nutting's term. Redistricted to the 28th district. | |
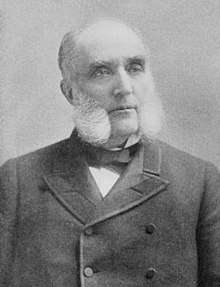 James J. Belden |
Republican | March 4, 1893 – March 3, 1895 |
53rd | Redistricted from the 25th district and re-elected in 1892. [data unknown/missing] |
1893–1903 [data unknown/missing] |
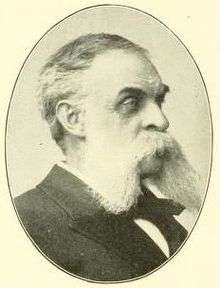 Theodore L. Poole |
Republican | March 4, 1895 – March 3, 1897 |
54th | [data unknown/missing] | |
 James J. Belden |
Republican | March 4, 1897 – March 3, 1899 |
55th | [data unknown/missing] | |
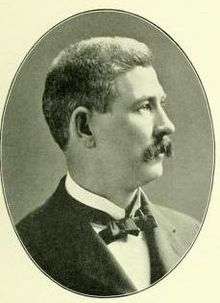 Michael E. Driscoll |
Republican | March 4, 1899 – March 3, 1903 |
56th 57th |
[data unknown/missing] Redistricted to the 29th district. | |
 James S. Sherman |
Republican | March 4, 1903 – March 3, 1909 |
58th 59th 60th |
Redistricted from the 25th district and re-elected in 1902. [data unknown/missing] |
1903–1913 [data unknown/missing] |
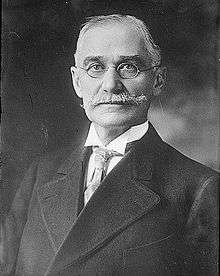 Charles S. Millington |
Republican | March 4, 1909 – March 3, 1911 |
61st | [data unknown/missing] | |
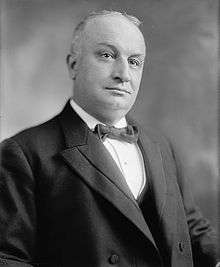 Charles A. Talcott |
Democratic | March 4, 1911 – March 3, 1913 |
62nd | [data unknown/missing] Redistricted to the 33rd district. | |
.jpg) George McClellan |
Democratic | March 4, 1913 – March 3, 1915 |
63rd | [data unknown/missing] | 1913–1945 All of Columbia, Greene, Schoharie, Sullivan, Ulster |
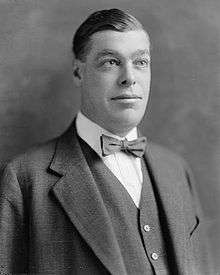 Charles B. Ward |
Republican | March 4, 1915 – March 3, 1925 |
64th 65th 66th 67th 68th |
[data unknown/missing] | |
 Harcourt J. Pratt |
Republican | March 4, 1925 – March 3, 1933 |
69th 70th 71st 72nd |
Elected in 1924. Re-elected in 1926. Re-elected in 1928. Retired. | |
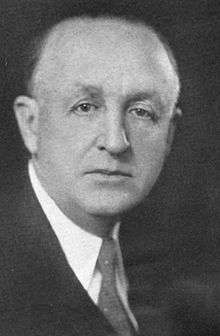 Philip A. Goodwin |
Republican | March 4, 1933 – June 6, 1937 |
73rd 74th 75th |
Elected in 1932. Re-elected in 1934. Re-elected in 1936. Died. | |
| Vacant | June 7, 1937 – November 1, 1937 |
75th | |||
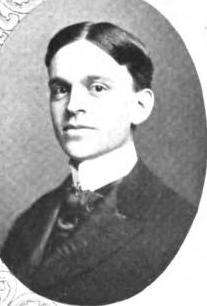 Lewis K. Rockefeller |
Republican | November 2, 1937 – January 3, 1943 |
75th 76th 77th |
Elected to finish Goodwin's term. [data unknown/missing] | |
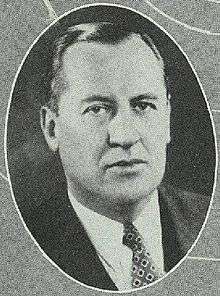 Jay LeFevre |
Republican | January 3, 1943 – January 3, 1945 |
78th | [data unknown/missing] Redistricted to the 30th district. | |
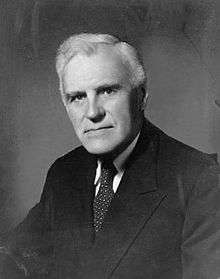 Ralph W. Gwinn |
Republican | January 3, 1945 – January 3, 1959 |
79th 80th 81st 82nd 83rd 84th 85th |
[data unknown/missing] | 1945–1963 All of Putnam, parts of Westchester |
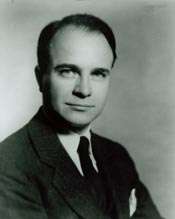 Robert R. Barry |
Republican | January 3, 1959 – January 3, 1963 |
86th 87th |
[data unknown/missing] Redistricted to the 25th district. | |
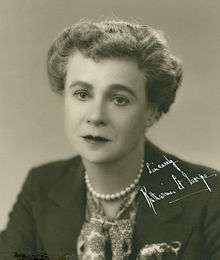 Katharine St. George |
Republican | January 3, 1963 – January 3, 1965 |
88th | Redistricted from the 28th district and re-elected in 1962. [data unknown/missing] |
1963–1971 All of Delaware, Orange, Rockland, Sullivan |
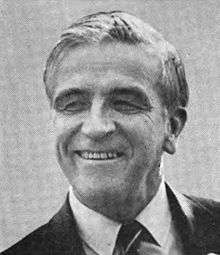 John G. Dow |
Democratic | January 3, 1965 – January 3, 1969 |
89th 90th |
[data unknown/missing] | |
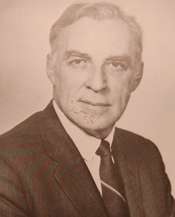 Martin B. McKneally |
Republican | January 3, 1969 – January 3, 1971 |
91st | [data unknown/missing] | |
 John G. Dow |
Democratic | January 3, 1971 – January 3, 1973 |
92nd | [data unknown/missing] | 1971–1973 All of Orange, Putnam, parts of Dutchess, Rockland, Sullivan |
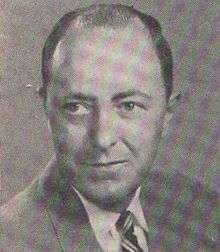 Howard W. Robison |
Republican | January 3, 1973 – January 3, 1975 |
93rd | Redistricted from the 33rd district and re-elected in 1972. [data unknown/missing] |
1973–1983 All of Broome, Sullivan, Tioga, parts of Chemung, Delaware, Tompkins, Ulster |
 Matthew F. McHugh |
Democratic | January 3, 1975 – January 3, 1983 |
94th 95th 96th 97th |
[data unknown/missing] Redistricted to the 28th district. | |
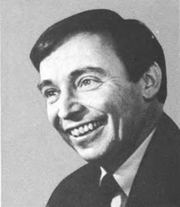 George C. Wortley |
Republican | January 3, 1983 – January 3, 1989 |
98th 99th 100th |
Redistricted from the 32nd district and re-elected in 1982. [data unknown/missing] |
1983–1993 All of Onondaga, parts of Madison |
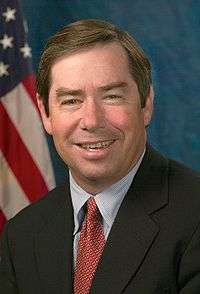 James T. Walsh |
Republican | January 3, 1989 – January 3, 1993 |
101st 102nd |
[data unknown/missing] Redistricted to the 25th district. | |
 L. William Paxon |
Republican | January 3, 1993 – January 3, 1999 |
103rd 104th 105th |
Redistricted from the 31st district and re-elected in 1992. [data unknown/missing] |
1993–2003 All of Genesee, Livingston, Ontario, Wayne, Wyoming, parts of Cayuga, Erie, Monroe, Seneca |
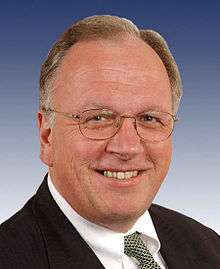 Thomas M. Reynolds |
Republican | January 3, 1999 – January 3, 2003 |
106th 107th |
[data unknown/missing] Redistricted to the 26th district. | |
 Jack Quinn |
Republican | January 3, 2003 – January 3, 2005 |
108th | Redistricted from the 30th district and re-elected in 2002. [data unknown/missing] |
2003–2013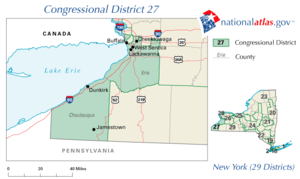 All of Chautauqua, part of Erie |
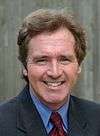 Brian Higgins |
Democratic | January 3, 2005 – January 3, 2013 |
109th 110th 111th 112th |
[data unknown/missing] Redistricted to the 26th district. | |
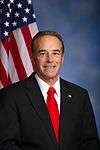 Chris Collins |
Republican | January 3, 2013 – October 1, 2019 |
113th 114th 115th 116th |
Elected in 2012. Re-elected in 2014. Re-elected in 2016. Re-elected in 2018. Resigned. |
2013–present All of Orleans, Genesee, Wyoming, Livingston, parts of Erie, Monroe, Niagara, Ontario .tif.png) |
| Vacant | October 1, 2019 – June 23, 2020 |
116th | |||
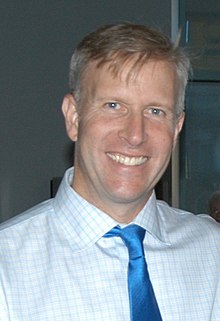 Chris Jacobs |
Republican | June 23, 2020 – present |
Elected to finish Collins's term. | ||
Election results
In New York State electoral politics there are numerous minor parties at various points on the political spectrum. Certain parties will invariably endorse either the Republican or Democratic candidate for every office, hence the state electoral results contain both the party votes, and the final candidate votes (listed as "Recap").
| Party | Candidate | Votes | % | ± | |
|---|---|---|---|---|---|
| Republican | Bill Paxon | 142,568 | 59.9% | ||
| Democratic | Thomas M. Fricano | 95,503 | 40.1% | ||
| Majority | 47,065 | 19.8% | |||
| Turnout | 238,071 | 100% | |||
| Party | Candidate | Votes | % | ± | |
|---|---|---|---|---|---|
| Republican | Thomas M. Reynolds | 102,042 | 57.3% | −2.6% | |
| Democratic | Bill Cook | 75,978 | 42.7% | +2.6% | |
| Majority | 26,064 | 14.6% | −5.2% | ||
| Turnout | 178,020 | 100% | −25.2% | ||
| Party | Candidate | Votes | % | ± | |
|---|---|---|---|---|---|
| Republican | Thomas M. Reynolds | 157,694 | 69.3% | +12.0% | |
| Democratic | Thomas W. Pecoraro | 69,870 | 30.7% | −12.0% | |
| Majority | 87,824 | 38.6% | +24.0% | ||
| Turnout | 227,564 | 100% | +27.8% | ||
| Party | Candidate | Votes | % | ± | |
|---|---|---|---|---|---|
| Republican | Jack Quinn | 120,117 | 69.1% | −0.2% | |
| Democratic | Peter Crotty | 47,811 | 27.5% | −3.2% | |
| Right to Life | Thomas Casey | 3,586 | 2.1% | +2.1% | |
| Green | Albert N. LaBruna | 2,405 | 1.4% | +1.4% | |
| Majority | 72,306 | 41.6% | +3.0% | ||
| Turnout | 173,919 | 100% | −23.6% | ||
| Party | Candidate | Votes | % | ± | |
|---|---|---|---|---|---|
| Democratic | Brian Higgins | 143,332 | 50.7% | +23.2% | |
| Republican | Nancy A. Naples | 139,558 | 49.3% | −19.8% | |
| Majority | 3,774 | 1.3% | −40.3% | ||
| Turnout | 282,890 | 100% | +62.7% | ||
| Party | Candidate | Votes | % | ± | |
|---|---|---|---|---|---|
| Democratic | Brian Higgins | 140,027 | 79.3% | +28.6% | |
| Republican | Michael J. McHale | 36,614 | 20.7% | −28.6% | |
| Majority | 103,413 | 58.5% | +57.2% | ||
| Turnout | 176,641 | 100% | −37.6% | ||
| Party | Candidate | Votes | % | ± | |
|---|---|---|---|---|---|
| Democratic | Brian Higgins | 185,713 | 74.4% | −4.9% | |
| Republican | Daniel J. Humiston | 56,354 | 22.6% | +1.9% | |
| Conservative | Harold W. Schroeder | 7,478 | 3% | +3% | |
| Majority | 129,359 | 51.8% | −6.7% | ||
| Turnout | 249,545 | 100% | +41.3% | ||
| Party | Candidate | Votes | % | ± | |
|---|---|---|---|---|---|
| Democratic | Brian Higgins | 119,085 | 60.9% | −13.5% | |
| Republican | Leonard A. Roberto | 76,320 | 39.1% | +16.5% | |
| Majority | 42,765 | 21.9% | 29.9% | ||
| Turnout | 195,405 | 100% | −21.7% | ||
| Party | Candidate | Votes | % | ± | |
|---|---|---|---|---|---|
| Republican | Chris Collins | 161,220 | 50.8% | +11.7% | |
| Democratic | Kathy Hochul | 156,219 | 49.2% | −11.7% | |
| Majority | 5,001 | 1.6% | −20.3% | ||
| Turnout | 317,439 | 100% | +62.4% | ||
| Party | Candidate | Votes | % | ± | |
|---|---|---|---|---|---|
| Republican | Chris Collins | 144,675 | 71.1% | +20.3% | |
| Democratic | Jim O'Donnell | 58,911 | 28.9% | −20.3% | |
| Majority | 85,764 | 42.2% | +40.6% | ||
| Turnout | 203,586 | 100% | −35.9% | ||
| Party | Candidate | Votes | % | ± | |
|---|---|---|---|---|---|
| Republican | Chris Collins | 220,885 | 67.2% | −3.9% | |
| Democratic | Diana Kastenbaum | 107,832 | 32.8% | +3.9% | |
| Majority | 113,053 | 34.4% | −7.8% | ||
| Turnout | 328,717 | 100% | +61.4% | ||
| Party | Candidate | Votes | % | ± | |
|---|---|---|---|---|---|
| Republican | Chris Collins | 140,146 | 49.1% | −18.1% | |
| Democratic | Nate McMurray | 139,059 | 48.8% | +16% | |
| Reform | Larry Piegza | 5,973 | 2.1% | +2.1% | |
| Majority | 1,087 | 0.3% | −34.1% | ||
| Turnout | 285,178 | 100% | −13.2% | ||
| Party | Candidate | Votes | % | ± | |
|---|---|---|---|---|---|
| Republican | Chris Jacobs | 75,323 [6] | 54.8% | +5.7% | |
| Democratic | Nathan McMurray | 59,859 | 43.5% | -5.3% | |
| Libertarian | Duane Whitmer | 1,373 | 1.0% | +1.0% | |
| Green | Michael Gammariello | 913 | 0.7% | +0.7% | |
| Majority | 15,464 | ||||
| Turnout | 137,468 | % | |||
See also
References
- Center for New Media & Promotion (CNMP), US Census Bureau. "My Congressional District". www.census.gov.
- "Partisan Voting Index – Districts of the 115th Congress" (PDF). The Cook Political Report. April 7, 2017. Retrieved April 7, 2017.
- McKinley, Jesse (June 24, 2020). "Republicans Retain House Seat in Special Election in Western N.Y." The New York Times. ISSN 0362-4331. Retrieved June 27, 2020.
- "NY Republican Chris Jacobs sworn in as newest House member". AP NEWS. July 21, 2020. Retrieved July 22, 2020.
- Orden, Erica (September 30, 2019). "Rep. Chris Collins to resign amid plans to plead guilty in insider trading case". CNN.
- "New York Special Election Results: 27th Congressional District". The New York Times. ISSN 0362-4331. Retrieved July 19, 2020.
- Martis, Kenneth C. (1989). The Historical Atlas of Political Parties in the United States Congress. New York: Macmillan Publishing Company.
- Martis, Kenneth C. (1982). The Historical Atlas of United States Congressional Districts. New York: Macmillan Publishing Company.
- "Biographical Directory of the U.S. Congress - Retro Search". bioguideretro.congress.gov. Retrieved May 11, 2020.
- 2004 House election data, Clerk of the United States House of Representatives
- 2002 House election data, Clerk of the United States House of Representatives
- 2000 House election data, Clerk of the United States House of Representatives
- 1998 House election data, Clerk of the United States House of Representatives
- 1996 House election data, Clerk of the United States House of Representatives