New Jersey's 2nd congressional district
New Jersey's 2nd congressional district, based in Southern New Jersey, is represented by Republican Jeff Van Drew. He was first elected as a Democrat in 2018, but announced on December 19, 2019 that he would be switching parties. The district, which is New Jersey's largest geographically, is a swing seat with a history of supporting different parties at the presidential and congressional level.
| New Jersey's 2nd congressional district | |||
|---|---|---|---|
.svg.png) District map as of 2013 | |||
| Representative |
| ||
| Distribution |
| ||
| Population (2017) | 713,380 | ||
| Median income | $65,467[1] | ||
| Ethnicity |
| ||
| Cook PVI | R+1[2] | ||
Counties and municipalities in the district
For the 113th and successive Congresses (based on redistricting following the 2010 Census), the congressional district contains all or portions of eight counties and 92 municipalities:[3]
- all 23 municipalities
- Bass River Township and Washington Township
- all 16 municipalities
- all 14 municipalities
- Clayton, East Greenwich Township (part), Elk Township, Franklin Township, Harrison Township, Mantua Township, Newfield, Pitman, South Harrison Township, Swedesboro and Woolwich Township
- Barnegat Light, Beach Haven, Eagleswood, Harvey Cedars, Little Egg Harbor Township, Long Beach Township, Ship Bottom, Stafford Township (part), Surf City, Tuckerton
- all 15 municipalities
Recent results from statewide elections
| Year | Office | Results |
|---|---|---|
| 1992 | President | Clinton 41 - 39% |
| 1996 | President | Clinton 50 - 36% |
| 2000 | President | Gore 54 - 43% |
| 2004 | President | Bush 50 - 49% |
| 2008 | President | Obama 53 - 45% |
| 2012 | President | Obama 53.5 - 45.4%[4] |
| 2016 | President | Trump 50.6 - 46.0%[4] |
List of members representing the district
District organized from the at-large district in 1799.
1799–1801: One seat
| Member | District home | Party | Years | Cong ress |
Electoral history | Counties in the District |
|---|---|---|---|---|---|---|
| Aaron Kitchell | Hanover | Democratic-Republican | March 4, 1799 – March 3, 1801 |
6th | Elected in 1798. Retired. |
Morris and Sussex |
District organized to the at-large district in 1801
1813–1815: Two seats
For the 13th Congress, elected in 1813, two seats were apportioned, elected at-large on a general ticket. This district was organized from the at-large district.
| Years | Cong ress |
Seat A | Seat B | Counties in the District | |||||||||
|---|---|---|---|---|---|---|---|---|---|---|---|---|---|
| Member | District home | Party | Electoral history | Member | District home | Party | Electoral history | ||||||
| March 4, 1813 – March 3, 1815 |
13th | .jpg) James Schureman |
New Brunswick | Federalist | Elected in 1813. Retired. |
.jpg) Richard Stockton |
Princeton | Federalist | Elected in 1813. Retired. |
Hunterdon, Middlesex, Monmouth, and Somerset Counties | |||
The District was merged into the at-large district in 1815
1843–present: One seat
District organized from the at-large district.
| Member | District home | Party | Years | Cong ress |
Electoral history | Counties/Towns in the District |
|---|---|---|---|---|---|---|
| George Sykes | Mount Holly | Democratic | March 4, 1843 – March 3, 1845 |
28th | [data unknown/missing] | 1843–1845: Burlington, Mercer, and Monmouth |
| Samuel G. Wright | Imlaystown | Whig | March 4, 1845 – July 30, 1845 |
29th | [data unknown/missing] Died. |
1845–1847: Burlington and Monmouth |
| Vacant | July 30, 1845 – November 4, 1845 | |||||
| George Sykes | Mount Holly | Democratic | November 4, 1845 – March 3, 1847 |
Elected to finish Wright's term. [data unknown/missing] | ||
 William A. Newell |
Allentown | Whig | March 4, 1847 – March 3, 1851 |
30th 31st |
[data unknown/missing] | 1847–1851: Burlington, Mercer, and Monmouth |
| Charles Skelton | Trenton | Democratic | March 4, 1851 – March 3, 1855 |
32nd 33rd |
[data unknown/missing] | 1851–1873: Burlington, Mercer, Monmouth, and Ocean |
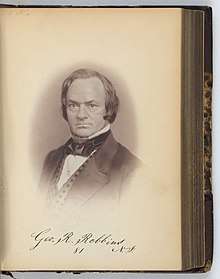 George R. Robbins |
Hamilton Square | Opposition | March 4, 1855 – March 3, 1857 |
34th 35th |
[data unknown/missing] | |
| Republican | March 4, 1857 – March 3, 1859 | |||||
 John L.N. Stratton |
Mount Holly | Republican | March 4, 1859 – March 3, 1863 |
36th 37th |
[data unknown/missing] | |
 George Middleton |
Allentown | Democratic | March 4, 1863 – March 3, 1865 |
38th | [data unknown/missing] | |
William A. Newell |
Allentown | Republican | March 4, 1865 – March 3, 1867 |
39th | [data unknown/missing] | |
| Charles Haight | [data unknown/missing] | Democratic | March 4, 1867 – March 3, 1871 |
40th 41st |
[data unknown/missing] | |
 Samuel C. Forker |
[data unknown/missing] | Democratic | March 4, 1871 – March 3, 1873 |
42nd | [data unknown/missing] | |
 Samuel A. Dobbins |
Mount Holly | Republican | March 4, 1873 – March 3, 1877 |
43rd 44th |
[data unknown/missing] | 1873–1903: Atlantic, Burlington, Mercer, and Ocean |
| John H. Pugh | [data unknown/missing] | Republican | March 4, 1877 – March 3, 1879 |
45th | [data unknown/missing] | |
 Hezekiah B. Smith |
[data unknown/missing] | Democratic | March 4, 1879 – March 3, 1881 |
46th | [data unknown/missing] | |
.jpg) J. Hart Brewer |
[data unknown/missing] | Republican | March 4, 1881 – March 3, 1885 |
47th 48th |
[data unknown/missing] | |
.jpg) James Buchanan |
[data unknown/missing] | Republican | March 4, 1885 – March 3, 1893 |
49th 50th 51st 52nd |
[data unknown/missing] | |
 John J. Gardner |
[data unknown/missing] | Republican | March 4, 1893 – March 3, 1913 |
53rd 54th 55th 56th 57th 58th 59th 60th 61st 62nd |
[data unknown/missing] | |
| 1903–1933: Atlantic, Burlington, Cape May, and Cumberland | ||||||
.jpg) J. Thompson Baker |
[data unknown/missing] | Democratic | March 4, 1913 – March 3, 1915 |
63rd | [data unknown/missing] | |
.jpg) Isaac Bacharach |
[data unknown/missing] | Republican | March 4, 1915 – January 3, 1937 |
64th 65th 66th 67th 68th 69th 70th 71st 72nd 73rd 74th |
[data unknown/missing] | |
| 1933–1967: Atlantic, Cape May, and Cumberland | ||||||
.jpg) Elmer H. Wene |
[data unknown/missing] | Democratic | January 3, 1937 – January 3, 1939 |
75th | [data unknown/missing] | |
.jpg) Walter S. Jeffries |
[data unknown/missing] | Republican | January 3, 1939 – January 3, 1941 |
76th | [data unknown/missing] | |
Elmer H. Wene |
[data unknown/missing] | Democratic | January 3, 1941 – January 3, 1945 |
77th 78th |
[data unknown/missing] | |
.jpg) T. Millet Hand |
Cape May | Republican | January 3, 1945 – December 26, 1956 |
79th 80th 81st 82nd 83rd 84th |
[data unknown/missing] Died. | |
| Vacant | December 26, 1956 – November 5, 1957 |
84th 85th | ||||
.jpg) Milton W. Glenn |
Margate City | Republican | November 5, 1957 – January 3, 1965 |
85th 86th 87th 88th |
Elected to finish Hand's term. [data unknown/missing] | |
 Thomas C. McGrath Jr. |
Margate City | Democratic | January 3, 1965 – January 3, 1967 |
89th | [data unknown/missing] | |
 Charles W. Sandman Jr. |
Cape May Court House | Republican | January 3, 1967 – January 3, 1975 |
90th 91st 92nd 93rd |
[data unknown/missing] | 1967–1969: Atlantic, Cape May, Cumberland, and Salem |
| 1969–1973: [data unknown/missing] | ||||||
| 1971–1983: Atlantic, Cape May, Cumberland, Salem, and parts of Burlington and Ocean | ||||||
 William J. Hughes |
Ocean City | Democratic | January 3, 1975 – January 3, 1995 |
94th 95th 96th 97th 98th 99th 100th 101st 102nd 103rd |
[data unknown/missing] | |
| 1983–1985: Atlantic, Cape May, Cumberland, Salem, and parts of Burlington and Ocean | ||||||
| 1985–1993: Atlantic, Cape May, Cumberland, Salem, and parts of Gloucester | ||||||
| 1993–2003: Atlantic, Cape May, Cumberland, Salem, and parts of Burlington and Gloucester | ||||||
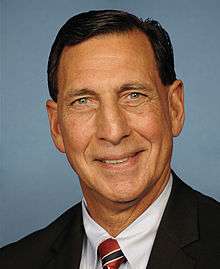 Frank LoBiondo |
Ventnor | Republican | January 3, 1995 – January 3, 2019 |
104th 105th 106th 107th 108th 109th 110th 111th 112th 113th 114th 115th |
[data unknown/missing] Retired. | |
| 2003–2013: Atlantic, Cape May, Cumberland, Salem, and parts of Burlington, Camden, and Gloucester | ||||||
| 2013–present: Atlantic, Cape May, Cumberland, Salem, and parts of Burlington, Camden, Gloucester, and Ocean | ||||||
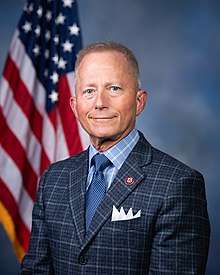 Jeff Van Drew |
Dennis Township | Democratic | January 3, 2019 – January 7, 2020 |
116th | Elected in 2018. | |
| Republican | January 7, 2020 – present | |||||
Recent electoral history
Results 1890–2018[5][6][7][8][9][10][11][12][13][14][15]
| Democratic | Votes | Pct | Republican | Votes | Pct | Other candidate | Votes | Pct | Other candidate | Votes | Pct | Other candidate | Votes | Pct | Other candidate | Votes | Pct | Other candidate | Votes | Pct | ||||||||
|---|---|---|---|---|---|---|---|---|---|---|---|---|---|---|---|---|---|---|---|---|---|---|---|---|---|---|---|---|
| 1844 | 7,573 | 51.9% | William Irick | 6,995 | 48.0% | |||||||||||||||||||||||
| 1844 | George Sykes | 6,503 | 48.5% | 6,919 | 51.5% | |||||||||||||||||||||||
| 1846 | Thomas E. Combes | 5,959 | 43.3% | 7,531 | 54.7% | (FNU) Ridson (Know Nothing) |
280 | 2.0% | ||||||||||||||||||||
| 1848 | Stacy G. Potts | 8,382 | 45.9% | 9,877 | 54.1% | |||||||||||||||||||||||
| 1852 | 10,229 | 52.2% | William Brown | 9,238 | 47.1% | Daniel Busby (Know Nothing) |
134 | 0.7% | ||||||||||||||||||||
| 1854 | Nathaniel S. Rue | 7,769 | 42.4% | 10,539 | 57.6% | |||||||||||||||||||||||
| 1856 | James W. Wall | 10,692 | 47.7% | 11,723 | 52.3% | |||||||||||||||||||||||
| 1858 | James W. Wall | 8,767 | 43.3% | 11,471 | 56.7% | |||||||||||||||||||||||
| 1860 | Augustus Green | 12,154 | 47.2% | 13,582 | 52.8% | |||||||||||||||||||||||
| 1862 | 12,182 | 52.9% | William Brown | 10,864 | 47.1% | |||||||||||||||||||||||
| 1864 | George Middleton | 13,091 | 48.4% | 13,953 | 51.6% | |||||||||||||||||||||||
| 1866 | 13,825 | 50.6% | William A. Newell | 13,476 | 49.4% | |||||||||||||||||||||||
| 1868 | 16,309 | 51.3% | James F. Rusling | 15,494 | 48.7% | |||||||||||||||||||||||
| 1870 | 15,899 | 50.7% | William A. Newell | 15,452 | 49.3% | |||||||||||||||||||||||
| 1872 | Samuel C. Forker | 11,787 | 45.4% | 14,192 | 54.6% | |||||||||||||||||||||||
| 1874 | Andrew J. Smith | 13,011 | 48.2% | 13,977 | 51.8% | |||||||||||||||||||||||
| 1876 | Hezekiah B. Smith | 15,485 | 49.2% | 16,015 | 50.8% | |||||||||||||||||||||||
| 1878 | 14,610 | 50.6% | John Howard Pugh | 18,580 | 47.4% | Charles E. Baker (National Prohibition) |
568 | 2.0% | ||||||||||||||||||||
| 1880 | Hezekiah B. Smith | 16,536 | 46.6% | 18,580 | 52.4% | Samuel A. Dobbins (Greenback) |
342 | 1.0% | ||||||||||||||||||||
| 1882 | Lewis Parker | 14,535 | 47.8% | 15,604 | 51.3% | Edward T. Howland (Greenback) |
270 | 0.9% | ||||||||||||||||||||
| 1884 | Franklin Gauntt | 16,853 | 45.4% | 19,144 | 51.5% | Henry B. Howell (National Prohibition) |
898 | 2.4% | Samuel A. Dobbins (Greenback) |
271 | 0.7% | |||||||||||||||||
| 1886 | Elias S. Reed | 15,065 | 42.6% | 17,767 | 50.2% | Leonard Brown (National Prohibition) |
2,547 | 7.2% | ||||||||||||||||||||
| 1888 | Chauncey H. Beasley | 19,104 | 44.6% | 22,407 | 52.4% | Minot C. Morgan (National Prohibition) |
1,292 | 3.0% | ||||||||||||||||||||
| 1890 | Wilson D. Haven | 16,352 | 46.6% | 17,515 | 50.0% | Leonard Brown (National Prohibition) |
1,200 | 3.4% | ||||||||||||||||||||
| 1892 | George D. Wetherill | 20,592 | 45.9% | 22,716 | 50.6% | F. French (National Prohibition) |
1,348 | 3.0% | D. Duroe (People's) |
169 | 0.4 | |||||||||||||||||
| 1894 | Martin L. Haines | 12,900 | 34.45% | 22,641 | 60.5% | Jacob D. Joslin (National Prohibition) |
1,278 | 3.4% | William B. Ellis (People's) |
630 | 1.7 | |||||||||||||||||
| 1896 | Abraham E. Conrow | 13,969 | 29.3% | 31,418 | 66.0% | R. Lowber Temple (National Democratic) |
1,076 | 2.3% | J. Bailie Adams (National Prohibition) |
1,036 | 2.2% | George Yardley (Socialist Labor) |
115 | 0.2 | ||||||||||||||
| 1898 | John F. Hall | 17,367 | 40.5% | 24,035 | 56.1% | Joseph J. Currie (National Prohibition) |
1,294 | 3.0% | John P. Weigel (Socialist Labor) |
153 | 0.4 | |||||||||||||||||
| 1900 | Thomas J. Prickett | 17,351 | 34.3% | 31,359 | 61.9% | Harry S. Powell (National Prohibition) |
1,419 | 2.8% | J. Louis Pancoast (Social Democratic) |
418 | 0.8% | Emil F. Wegener (Socialist Labor) |
75 | 0.1% | ||||||||||||||
| 1902 | Thomas A. Gash | 9,465 | 29.6% | 19,966 | 62.5% | Marion R. Owen (National Prohibition) |
2,323 | 7.3% | Daniel W. Davis (Socialist Labor) |
199 | 0.6% | |||||||||||||||||
| 1904 | Samuel E. Perry | 13,035 | 34.2% | 26,296 | 59.7% | Thomas H. Landon (National Prohibition) |
1,406 | 4.0% | Robert W. Buckley (Socialist) |
254 | 2.1% | Marion R. Owen (People's Dem.) |
209 | 2.1% | ||||||||||||||
| 1906 | Samuel E. Perry | 8,921 | 28.6% | 19,637 | 63.0% | William Riddle (Labor & Lincoln) |
1,249 | 4.0% | W. F. Tower (National Prohibition) |
900 | 2.9% | Morris Korshet (Socialist) |
380 | 1.2% | Marion R. Owen (Home Rule) |
105 | 0.3% | |||||||||||
| 1908 | Edward Burd Grubb | 20,506 | 44.8% | 23,906 | 52.2% | James E. Steelman (National Prohibition) |
1,012 | 2.2% | John B. Leeds (Socialist) |
347 | 0.8% | |||||||||||||||||
| 1910 | George Hampton | 16,915 | 38.2% | 22,861 | 51.6% | William Riddle (Independent Labor) |
3,508 | 7.9% | John W. Hughes (National Prohibition) |
738 | 1.7% | George S. Rawcliffe (Socialist) |
295 | 0.7% | ||||||||||||||
| 1912 | 16,130 | 45.0% | John J. Gardner | 12,330 | 34.4% | Francis D. Potter (Progressive) |
7,384 | 20.6% | ||||||||||||||||||||
| 1914 | J. Thompson Baker | 14,352 | 35.2% | 21,448 | 52.6% | William H. Bright (Progressive Roosevelt) |
3,508 | 8.6% | James Chapman (National Prohibition) |
775 | 1.9% | G. A. McKeon (Socialist) |
673 | 1.7% | ||||||||||||||
| 1916 | William Myers | 14,220 | 34.2% | 24,865 | 59.7% | J. Ward Gamble (National Prohibition) |
1,654 | 4.0% | Abraham Warren (Socialist) |
880 | 2.1% | |||||||||||||||||
| 1918 | John T. French | 8,610 | 28.2% | 20,744 | 67.9% | Levi B. Sharp (National Prohibition) |
1,206 | 3.9% | ||||||||||||||||||||
| 1920 | William E. Jonah | 21,511 | 29.5% | 51,006 | 70.0% | George E. Strother (Socialist) |
331 | 0.5% | ||||||||||||||||||||
| 1922 | Charles S. Stevens | 22,001 | 30.2% | 50,925 | 69.8% | |||||||||||||||||||||||
| 1924 | Charles S. Stevens | 21,185 | 23.8% | 67,668 | 76.2% | |||||||||||||||||||||||
| 1926 | Frank Melville | 12,775 | 19.4% | 53,174 | 80.6% | |||||||||||||||||||||||
| 1928 | George R. Greis | 30,856 | 23.7% | 99,109 | 76.3% | |||||||||||||||||||||||
| 1930 | Hans Froelicher Jr. | 17,125 | 20.1% | 67,729 | 79.7% | Florian Ambroseh (Communist) |
155 | 0.2% | ||||||||||||||||||||
| 1932 | Harry R. Coulomb | 35,257 | 36.4% | 60,963 | 62.9% | Albert H. Schreiber (Socialist-Labor) |
413 | 0.4% | Walter L. Yerkes (Prohibition) |
292 | 0.3% | |||||||||||||||||
| 1934 | Charles W. Ackley | 48,743 | 49.3% | 49,824 | 50.4% | Franklin L. Watkins (Socialist-Labor) |
226 | 0.2% | ||||||||||||||||||||
| 1936 | 55,580 | 50.0% | Isaac Bacharach | 50,958 | 45.8% | Ted Lenore (Townsend Nonpartisan) |
3,241 | 2.9% | U. G. Robinson (Prop. Home Protection) |
1,206 | 1.1% | Franklin L. Watkins (Socialist) |
97 | 0.1% | Frank A. Yacovelli (Townsend Social Justice) |
86 | 0.1% | Thomas F. Ogilvie (End Poverty Const) |
18 | <0.1% | ||||||||
| 1938 | Elmer H. Wene | 55,344 | 49.1% | 57,090 | 50.1% | Isaac Stalberg (Roosevelt Liberal Independent) |
222 | 0.2% | Margaret V. Moody (National Prohibition) |
91 | 0.1% | Anthon B. Ferretti (Independent Peoples) |
47 | <0.1% | Frank B. Hubin (Roosevelt Independent) |
23 | <0.1% | |||||||||||
| 1940 | 60,392 | 52.4% | Walter S. Jeffries | 54,897 | 47.6% | Joseph B. Sharp (Prohibition) |
35 | <0.1% | ||||||||||||||||||||
| 1942 | 40,478 | 53.0% | Benjamin D. Foulois | 35,930 | 47.0% | |||||||||||||||||||||||
| 1944 | Edison Hedges | 42,862 | 45.6% | 51,194 | 54.4% | |||||||||||||||||||||||
| 1946 | Edward T. Keeley | 26,740 | 32.9% | 54,511 | 67.1% | |||||||||||||||||||||||
| 1948 | William E. Stringer | 38,194 | 37.5% | 62,804 | 61.7% | Thomas F. Ogilvie (Progressive) |
764 | 0.8% | ||||||||||||||||||||
| 1952 | Charles Edward Rupp | 46,174 | 36.6% | 79,955 | 63.4% | |||||||||||||||||||||||
| 1954 | Clayton E. Burdick | 37,541 | 36.4% | 65,551 | 63.6% | Morris Karp (Socialist-Labor) |
56 | 0.1% | ||||||||||||||||||||
| 1956 | Thomas C. Stewart | 39,383 | 32.0% | 83,433 | 67.8% | Morris Karp (Socialist-Labor) |
151 | 0.1% | ||||||||||||||||||||
| 1958 | Joseph G. Hancock | 50,558 | 46.1% | 58,621 | 53.4% | Morris Karp (Socialist-Labor) |
547 | 0.5% | ||||||||||||||||||||
| 1960 | John A. Miller | 59,520 | 43.2% | 77,894 | 56.5% | Morris Karp (Socialist-Labor) |
338 | 0.2% | ||||||||||||||||||||
| 1962 | Paul R. Porreca | 54,317 | 46.7% | 61,285 | 52.7% | Elwin Baker (Socialist Labor) |
625 | 0.5% | ||||||||||||||||||||
| 1964 | 73,264 | 50.8% | Milton W. Glenn | 70,997 | 49.2% | |||||||||||||||||||||||
| 1966 | Thomas C. McGrath Jr. | 65,494 | 46.9% | 72,014 | 51.5% | Albert Ronis (Socialist Labor) |
1,259 | 0.9% | Lindwood W. Erickson Jr. (Conservative) |
991 | 0.7% | |||||||||||||||||
| 1968 | David Dichter | 73,361 | 44.4% | 91,218 | 55.3% | Albert Ronis (Socialist Labor) |
505 | 0.3% | ||||||||||||||||||||
| 1970 | William J. Hughes | 64,882 | 48.3% | 69,392 | 51.7% | |||||||||||||||||||||||
| 1972 | John D. Rose | 69,374 | 34.3% | 133,096 | 65.7% | |||||||||||||||||||||||
| 1974 | 109,763 | 57.3% | Charles W. Sandman Jr. | 79,064 | 41.3% | Andrew Wenger (Independent) |
2,693 | 1.4% | ||||||||||||||||||||
| 1976 | 141,753 | 61.7% | James R. Hurley | 87,915 | 38.3% | |||||||||||||||||||||||
| 1978 | 112,768 | 66.4% | James H. Biggs | 56,997 | 33.6% | |||||||||||||||||||||||
| 1980 | 135,437 | 57.5% | Beech N. Fox | 97,072 | 41.2% | Robert C. Rothhouse (Libertarian) |
2,262 | 1.0% | Adele Frisch (Socialist Labor) |
939 | 0.4% | |||||||||||||||||
| 1982 | 102,826 | 68.0% | John J. Mahoney | 47,069 | 31.1% | Bruce Powers (Libertarian) |
1,233 | 0.8% | ||||||||||||||||||||
| 1984 | 132,841 | 63.2% | Raymond G. Massie | 77,231 | 36.8% | |||||||||||||||||||||||
| 1986 | 83,821 | 68.3% | Alfred J. Bennington Jr. | 35,167 | 28.6% | Len Smith (Pro Life, Anti-Abortion) |
3,812 | 3.1% | ||||||||||||||||||||
| 1988 | 134,505 | 65.7% | Kirk W. Conover | 67,759 | 33.1% | Richard A. Schindewolf Jr. (Pro-Life Conservative) |
2,372 | 1.2% | ||||||||||||||||||||
| 1990 | 97,698 | 88.2% | (no candidate) | William A. Kanengiser (Populist) |
13,120 | 11.8% | ||||||||||||||||||||||
| 1992 | 132,465 | 55.9% | Frank A. LoBiondo | 98,315 | 41.5% | Roger W. Bacon (Libertarian) |
2,575 | 1.1% | Joseph Ponczek (Anti-Tax) |
2,067 | 0.9% | Andrea Lippi (Freedom, Equality, Prosperity) |
1,605 | 0.7% | ||||||||||||||
| 1994 | Louis N. Magazzu | 56,151 | 35.4% | 102,566 | 64.6% | |||||||||||||||||||||||
| 1996 | Ruth Katz | 83,890 | 38.0% | 133,131 | 60.3% | David Rodger Headrick (Independent) |
1,439 | 0.7% | Judith Lee Azaren (Independent) |
1,174 | 0.5% | Andrea Lippi (Independent) |
1,084 | 0.5% | ||||||||||||||
| 1998 | Derek Hunsberger | 43,563 | 30.8% | 93,248 | 65.9% | Glenn Campbell (Independent) |
2,955 | 2.1% | Mary A. Whittam (Independent) |
1,748 | 1.2% | |||||||||||||||||
| 2000 | Edward G. Janosik | 74,632 | 31.9% | 155,187 | 66.4% | Robert Gabrielsky (Independent) |
3,252 | 1.4% | Constantino Rozzo (Independent) |
788 | 0.3% | |||||||||||||||||
| 2002 | Steven A. Farkas | 47,735 | 28.3% | 116,834 | 69.2% | Roger Merle (Green) |
1,739 | 1.0% | Michael J. Matthews Jr. (Libertarian) |
1,720 | 1.0% | Costantino Rozzo (Socialist Party USA) |
771 | 0.5% | ||||||||||||||
| 2004 | Timothy J. Robb | 86,792 | 32.7% | 172,779 | 65.1% | Willie Norwood (Jobs Equality Business) |
1,993 | 0.8% | Michael J. Matthews Jr. (Libertarian) |
1,767 | 0.7% | Jose David Alcantara (Green) |
1,516 | 0.6% | Costantino Rozzo (Socialist Party USA) |
595 | 0.2% | |||||||||||
| 2006 | Viola Thomas-Hughes | 64,277 | 35.6% | 111,245 | 61.6% | Robert E. Mullock (Preserve Green Space) |
3,071 | 1.7% | Lynn Merle (A New Direction) |
992 | 0.5% | Thomas Fanslau (We The People) |
603 | 0.3% | Willie Norwood (Socialist) |
385 | 0.2% | |||||||||||
| 2008 | David C. Kurkowski | 110,990 | 39.1% | 167,701 | 59.1% | Jason M. Grover (Green) |
1,763 | 0.6% | Peter Frank Boyce (Constitution) |
1,551 | 0.5% | Gary Stein (Rock the Boat) |
1,312 | 0.5% | Costantino Rozzo (Socialist Party USA) |
648 | 0.2% | |||||||||||
| 2010 | Gary Stein | 51,690 | 30.9% | 109,460 | 65.5% | Peter Frank Boyce (Constitution) |
4,120 | 2.5% | Mark Lovett (marklovett.us) |
1,123 | 0.7% | Vitov Valdes-Munoz (American Labor) |
727 | 0.4% | ||||||||||||||
| 2012 | Cassandra Shober | 116,463 | 40.3% | 166,679 | 57.7% | John Ordille (Libertarian) |
2,699 | 0.9% | Charles Lukens (Constitutional Conservative) |
1,329 | 0.5% | David W. Bowen Sr. (The People's Agenda) |
1,010 | 0.3% | Frank Faralli Jr. (Conservative, Compassionate, Creative) |
892 | 0.3% | |||||||||||
| 2014 | Bill Hughes Jr. | 62,986 | 37.0% | 104,958 | 61.7% | Alexander H. Spano (Democratic-Republican (New)) |
637 | 0.4% | Gary Stein (Various slogans) |
575 | 0.3% | Costantino Rozzo (American Labor (New)) |
473 | 0.3% | Bayode Olabisi (Making Us Better) |
447 | 0.3% | |||||||||||
| 2016 | David Cole | 110,838 | 37.2% | 176,338 | 59.2% | John Ordille (Libertarian) |
3,773 | 1.3% | James Keenan (Make Government Work) |
2,653 | 0.9% | Steven Fenichel (Representing the 99%) |
1,574 | 0.5% | Eric Beechwood (People's Independent Progressive) |
1,387 | 0.5% | Gabriel Brian Franco (For Political Revolution) |
1,232 | 0.4% | ||||||||
| 2018 | 125,755 | 52.3% | Seth Grossman | 110,491 | 45.9 | John Ordille (Libertarian) |
1,631 | 0.6% | Steven Fenichel (Time for Truth) |
1,046 | 0.4% | Anthony Parisi Sanchez (Cannot Be Bought) |
964 | 0.4% | William R. Benfer (Independent) |
816 | 0.4% | |||||||||||
References
- https://www.census.gov/mycd/?st=34&cd=02
- "Partisan Voting Index – Districts of the 115th Congress" (PDF). The Cook Political Report. April 7, 2017. Retrieved April 7, 2017.
- Plan Components Report, New Jersey Redistricting Commission, December 23, 2011. Accessed November 6, 2016.
- Nir, David. "Daily Kos Elections' presidential results by congressional district for the 2016 and 2012 elections", Daily Kos, November 19, 2012. Accessed November 12, 2017.
- "Election Statistics". Office of the Clerk of the House of Representatives. Retrieved September 20, 2013.
- 2012 Official General Election Results, House of Representatives, New Jersey Department of State, for 2012 results
- Lundy, F. L.; Fitzgerald, Thomas F.; Gosson, Louis C.; Fitzgerald, Josephine A.; Dullard, John P.; Gribbins, J. Joseph (January 1, 1907). Fitzgerald's Legislative Manual, State of New Jersey. J.A. Fitzgerald.
- Lundy, F. L.; Fitzgerald, Thomas F.; Gosson, Louis C.; Fitzgerald, Josephine A.; Dullard, John P.; Gribbins, J. Joseph (January 1, 1905). Manual of the Legislature of New Jersey. J.A. Fitzgerald.
- Fitzgerald, Thomas F. (January 1, 1911). Fitzgerald's Legislative Manual, State of New Jersey. J.A. Fitzgerald.
- Langland, James (January 1, 1914). The Troy Record Almanac and Year-book. The Troy record Co.
- Lundy, F. L.; Fitzgerald, Thomas F.; Gosson, Louis C.; Fitzgerald, Josephine A.; Dullard, John P.; Gribbins, J. Joseph (January 1, 1915). Manual of the Legislature of New Jersey. J.A. Fitzgerald.
- Lundy, F. L.; Fitzgerald, Thomas F.; Gosson, Louis C.; Fitzgerald, Josephine A.; Dullard, John P.; Gribbins, J. Joseph (January 1, 1917). Manual of the Legislature of New Jersey. J.A. Fitzgerald.
- Lundy, F. L.; Fitzgerald, Thomas F.; Gosson, Louis C.; Fitzgerald, Josephine A.; Dullard, John P.; Gribbins, J. Joseph (January 1, 1919). Manual of the Legislature of New Jersey. J.A. Fitzgerald.
- Greeley, Horace (January 1, 1910). The Tribune Almanac and Political Register. The Tribune Association.
- The Tribune Almanac and Political Register for ... Greeley & McElrath. January 1, 1903.
- Martis, Kenneth C. (1989). The Historical Atlas of Political Parties in the United States Congress. New York: Macmillan Publishing Company.
- Martis, Kenneth C. (1982). The Historical Atlas of United States Congressional Districts. New York: Macmillan Publishing Company.
- Congressional Biographical Directory of the United States 1774–present