Minnesota's 4th congressional district
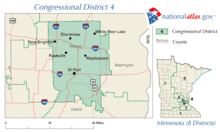
Minnesota's 4th congressional district covers nearly all of Ramsey County, and part of Washington County. It includes all of St. Paul and most of its suburbs. The district is solidly Democratic with a CPVI of D + 14.[6] It is currently represented by Betty McCollum, of the Minnesota Democratic-Farmer-Labor Party (DFL). The DFL has held the seat without interruption since 1949, and all but one term (1947-9) since the merger of the Democratic and Farmer-Labor Parties.
| Minnesota's 4th congressional district | |||
|---|---|---|---|
.tif.png) Minnesota's 4th congressional district - since January 3, 2013. | |||
| Representative |
| ||
| Area | 202[1] sq mi (520 km2) | ||
| Distribution |
| ||
| Population (2018 est.) | 717,766[3] | ||
| Median income | $71,503[4] | ||
| Ethnicity | |||
| Cook PVI | D+14[6] | ||
| External image | |
|---|---|
List of representatives
| Representative | Party | Years | Congress | Notes | Location |
|---|---|---|---|---|---|
| District created | March 4, 1883 | Created after the 1880 U.S. Census | Hennepin | ||
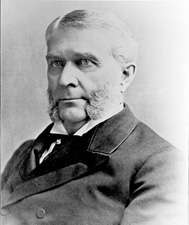 |
Republican | March 4, 1883 – March 3, 1885 | 48th | Lost renomination | |
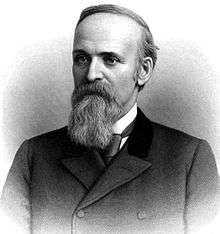 |
Republican | March 4, 1885 – March 3, 1887 | 49th | Lost reelection | |
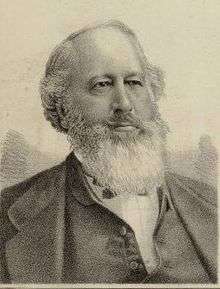 |
Democratic | March 4, 1887 – March 3, 1889 | 50th | Lost reelection | |
 |
Republican | March 4, 1889 – March 3, 1891 | 51st | Lost reelection | |
 |
Democratic | March 4, 1891 – March 3, 1893 | 52nd | Lost reelection | Chisago |
 |
Republican | March 4, 1893 – March 3, 1897 | 53rd 54th |
Retired | |
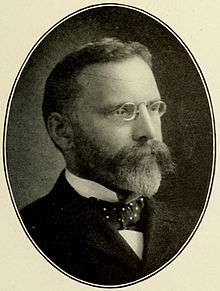 |
Republican | March 4, 1897 – March 3, 1915 | 55th 56th 57th 58th 59th 60th 61st 62nd 63rd |
Lost reelection | Chisago |
 |
Democratic | March 4, 1915 – May 20, 1919 | 64th 65th 66th |
Died | Ramsey |
| Vacant | May 20, 1919 – July 1, 1919 | ||||
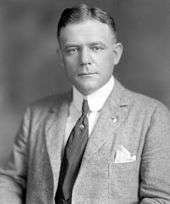 |
Republican | July 1, 1919 – March 3, 1927 | 66th 67th 68th 69th |
Lost renomination | |
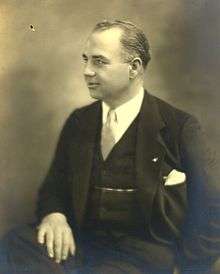 |
Republican | March 4, 1927 – March 3, 1933 | 70th 71st 72nd |
Lost reelection | |
| March 4, 1933 – January 3, 1935 | District inactive, all representatives elected At-large on a general ticket | ||||
 |
Republican | January 3, 1935 – January 3, 1945 | 74th 75th 76th 77th 78th |
Lost reelection | Ramsey |
 |
DFL | January 3, 1945 – January 3, 1947 | 79th | Lost reelection | |
 |
Republican | January 3, 1947 – January 3, 1949 | 80th | Lost reelection | |
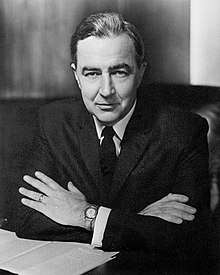 |
DFL | January 3, 1949 – January 3, 1959 | 81st 82nd 83rd 84th 85th |
Ran for U.S. Senate (successful) | |
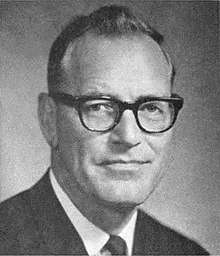 |
DFL | January 3, 1959 – January 3, 1977 | 86th 87th 88th 89th 90th 91st 92nd 93rd 94th |
Retired | Ramsey |
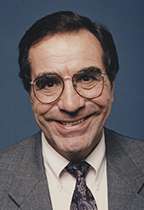 |
DFL | January 3, 1977 – October 10, 2000 | 95th 96th 97th 98th 99th 100th 101st 102nd 103rd 104th 105th 106th |
Died | |
| Vacant | October 10, 2000 - January 3, 2001 | ||||
.jpg) |
DFL | January 3, 2001 – present | 107th 108th 109th 110th 111th 112th 113th 114th 115th 116th |
Incumbent | |
Elections
| Year | Democratic | Republican | Other |
|---|---|---|---|
| 1918 | √ Carl Van Dyke: 62.0% | Walter Mallory: 38.0% | |
| 1920 | Thomas J. Brady: 34.2% | √ Oscar Keller: 58.7%
Carl W. Cummins: 7.1% |
|
| 1922 | Paul E. Doty: 35.6% | √ Oscar Keller: 58.7% | O. J. McCartney (Independent): 5.7% |
| 1924 | Dan W. Lawler: 36.8% | √ Oscar Keller: 47.7% | Julius F. Emme (Farmer-Labor) 15.4% |
| 1926 | Charles C. Kolars: 15.4% | √ Melvin Maas: 54.3% | Thomas V. Sullivan (Farmer-Labor) 41.0% |
| 1928 | John P. J. Dolan: 28.6% | √ Melvin Maas: 36% | Howard Y. Williams (Farmer-Labor): 21.0%
Fred A. Snyder (Independent): 14.0% Maurice Powers (Independent): 0.5% |
| 1930 | Frank Munger: 9.0% | √ Melvin Maas: 66.5% | Claus V. Hammerstrom (Farmer-Labor): 22.1%
A. W. Anderson (Independent): 2.3% |
| 1932 | (Congress elected on a general ticket after state legislature failed to redraw districts after 1930 census) | ||
| 1934 | John J. McDonough: 23.4% | √ Melvin Maas: 36.8% | A. E. Smith (Farmer-Labor): 29.4%
Charles J. Andre (Independent): 9.9% Thomas Tracy (Independent): 0.5% |
| 1936 | A. B. C. Doherty: 22.9% | √ Melvin Maas: 38.3% | Howard Y. Williams (Farmer-Labor): 38.0%
Otis A. Luce (Independent): 0.7% |
| 1938 | A. B. C. Doherty: 11.1% | √ Melvin Maas: 53.1% | Howard Y. Williams (Farmer-Labor): 35.8% |
| 1940 | Willard J. Moran: 12.9% | √ Melvin Maas: 58.8% | George L. Siegel (Farmer-Labor): 28.2% |
| 1942 | Edward K. Delaney: 9.8% | √ Melvin Maas: 65.1% | William Mahoney (Farmer-Labor): 24.2%;
Rose Tillotson (Communist Party USA) 0.9% |
| 1944 | √ Frank Starkey: 51.8% | Melvin Maas: 48.2% | |
| 1946 | Frank Starkey: 47.2% | √ Edward Devitt: 51.5% | Dorothy Schultz (Independent): 1.3% |
| 1948 | √ Eugene McCarthy: 59.4% | Edward Devitt: 40.6% | |
| 1950 | √ Eugene McCarthy: 60.4% | Ward Fleming: 39.6% | |
| 1952 | √ Eugene McCarthy: 61.7% | Roger G. Kennedy: 38.3% | |
| 1954 | √ Eugene McCarthy: 63.0% | Richard C. Hansen: 37.0% | |
| 1956 | √ Eugene McCarthy: 64.1% | Edward C. Slettedahl: 35.9% | |
| 1958 | √ Joseph Karth: 56.4% | Frank S. Farrell: 43.6% | |
| 1960 | √ Joseph Karth: 61.0% | Joseph J. Mitchell: 39.0% | |
| 1962 | √ Joseph Karth: 59.5% | Harry Strong: 40.5% | |
| 1964 | √ Joseph Karth: 72.3% | John M. Drexler: 27.1% | Write-in: 0.7% |
| 1966 | √ Joseph Karth: 53.4% | Stephen Maxwell: 46.6% | |
| 1968 | √ Joseph Karth: 61.3% | Emery Barrette: 38.7% | |
| 1970 | √ Joseph Karth: 74.2% | Frank L. Loss:) 25.8% | |
| 1972 | √ Joseph Karth: 72.4% | Steve Thompson: 27.6% | |
| 1974 | √ Joseph Karth: 76.0% | Joseph A. Rheinberger: 24.0% | |
| 1976 | √ Bruce Vento: 66.4% | Andrew Engebretson: 29.8% | Alan W. Uhl (Independent): 1.5%
Thomas F. Piotrowski (Libertarian): 1.4% Ralph Schwartz (Socialist Workers): 0.9% |
| 1978 | √ Bruce Vento: 58.0% | John Berg: 42.0% | |
| 1980 | √ Bruce Vento: 58.5% | John Berg: 40.5% | James Kendrick (Socialist Workers) 1.0% |
| 1982 | √ Bruce Vento: 73.2% | Bill James: 26.8% | |
| 1984 | √ Bruce Vento: 73.5% | Mary Jane Rachner: 25.2% | Peter Brandli (Socialist Workers) 1.3% |
| 1986 | √ Bruce Vento: 72.9% | Harold Stassen 27.1% | |
| 1988 | √ Bruce Vento: 72.4% | Ian Maitland: 26.8% | Natasha Terlexis (Socialist Workers) 0.7% |
| 1990 | √ Bruce Vento: 64.7% | Ian Maitland: 35.1% | |
| 1992 | √ Bruce Vento: 57.6% | Ian Maitland: 37.6% | James Willess (Independent): 2.4%
Dan R. Vacek (Grassroots) 1.6% Lynn Marvin Johnson (Natural Law) 1.3% Jo Rothenberg (Socialist Workers) 0.4% |
| 1994 | √ Bruce Vento: 54.7% | Dennis Newinski: 41.8% | Dan R. Vacek (Grassroots): 2.9% |
| 1996 | √ Bruce Vento: 57.02% | Dennis Newinski: 36.80% | Richard Gibbons (Reform): 3.64%
Phil Willkie (Grassroots): 1.41% Dan Vacek (Grassroots): 1.05% |
| 1998 | √ Bruce Vento: 53.7% | Dennis Newinski: 39.8% | Dan R. Vacek (Legal Marijuana Now): 2.4%
Carol Simmons Schulstad (Minnesota Taxpayers): 1.9% Michael A. Neitzel (Libertarian): 1.2% Heather Wood (Socialist Workers): 0.9% |
| 2000 | √ Betty McCollum: 48.04% | Linda Runbeck: 30.89% | Tom Foley (Independence): 20.59%;
Nicholas Skrivanek (Constitution): 0.47% |
| 2002 | √ Betty McCollum: 62.22% | Clyde Billington: 33.91% | Steve J. Raskiewicz (Green): 3.75% |
| 2004 | √ Betty McCollum: 57.5% | Patrice Bataglia: 33.2% | Peter Vento (Independence): 9.2% |
| 2006 | √ Betty McCollum: 69.5% | Obi Sium: 30.2% | |
| 2008 | √ Betty McCollum: 68.4% | Ed Matthews: 31.3% | |
| 2010 | √ Betty McCollum: 59.2% | Teresa Collett: 34.7% | Steve Carlson (Independence): 6.1% |
| 2012 | √ Betty McCollum: 62.27% | Tony Hernandez: 31.51% | Steve Carlson (Independence): 6.07% |
| 2014 | √ Betty McCollum: 61.2% | Sharna Wahlgren: 32.9% | Dave Thomas (Independence): 5.8%;
Write-ins: 0.1% |
| 2016 | √ Betty McCollum: 57.8% | Greg Ryan: 34.4% | Susan Pendergast Sindt (Legal Marijuana Now): 7.7% |
| 2018 | √ Betty McCollum: 66.0% | Greg Ryan: 29.7% | Susan Pendergast Sindt (Legal Marijuana Now): 4.2% |
Election results from recent statewide races
Statewide election voting
| Election results from statewide races | Political parties that won the district | ||
|---|---|---|---|
| Year | Office | Results | |
| 2000 | President | Gore 57 - 37% | Democratic Party (United States) |
| 2004 | President | Kerry 62 - 37% | Democratic Party (United States) |
| 2008 | President | Obama 64 - 34% | Democratic Party (United States) |
| 2012 | President | Obama 63 - 36% | Democratic Party (United States) |
| 2016 | President | Clinton 62 - 31% | Democratic Party (United States) |
| 2018 | Senator | Klobuchar 70.7 - 26.0% | Democratic Party (United States) |
Historical district boundaries
References
- "Minnesota congressional districts by urban and rural population and land area" (PDF). US Census Bureau. 2000. Retrieved 2007-04-02.
- Geography, US Census Bureau. "Congressional Districts Relationship Files (state-based)". www.census.gov. Retrieved 10 April 2018.
- Bureau, Center for New Media & Promotion (CNMP), US Census. "My Congressional District". www.census.gov. Retrieved 10 April 2018.
- https://www.census.gov/mycd/?st=27&cd=04
- https://censusreporter.org/profiles/50000US2704-congressional-district-4-mn/
- "Partisan Voting Index – Districts of the 115th Congress" (PDF). The Cook Political Report. April 7, 2017. Retrieved April 7, 2017.