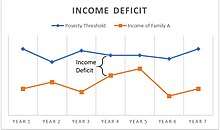
Income deficit
Income deficit is the difference between a single person or family's income and its poverty threshold or poverty line, when the former is exceeded by the latter.[1] Data on the income deficits of various members of a population allow for the construction of one type of measurement of income inequality in that population. Individuals or families that fall below the line are considered to be in poverty whereas families that fall above are not.[2] The income deficit is one of two measures that are used to determine a person or family's income distance from the poverty threshold, the other being a ratio rather than a difference.
The net income deficit consists largely of income payments and receipts on capital, as well as cross-border labour income (compensation of employees). Given the relatively small level of net cross-border labor income payments, there are two key drivers of the net income deficit: the level of net foreign liabilities being financed and the yield on those liabilities.https://treasury.gov.au/sites/default/files/2019-03/round6.pdf

Poverty threshold
The poverty threshold in the U.S. is updated each year by the U.S. Census Bureau.[3] The number is adjusted according to inflation to reflect the updated cost of living in particular areas. In 2016 12.7% of Americans were living below the poverty threshold.[4] Poverty thresholds depend on the number of people living in the household.
Problems with income deficit
There is still debate as to how to accurately calculate poverty, and which factors would be the most appropriate.[5] While the poverty line reflects the general circumstances of a household (specifically, number of people and location), it does not capture the household's individual circumstances, such as health problems. Therefore, supplemental poverty measures are also used to better represent the data.[6]
US Income Deficit
In the United States, the census bureau separates data collected into several different categories.[7] Each category is then separated even further by number of children, age of children, yearly salary, social security income, et cetera. The data below shows the average of each subcategory within the three larger ones. Data is from the year 2016.
- Families have a mean income deficit of $10,505.[8]
- Married-couple families have a mean income deficit of $11,139.[9]
- Families with female householder and no male present have a mean income deficit of $9,991.[10]
References
- Staff, Investopedia (8 January 2004). "Deficit". Investopedia. Retrieved 26 September 2017.
- "What are Poverty Thresholds and Poverty Guidelines? | Institute for Research on Poverty | University of Wisconsin–Madison". www.irp.wisc.edu. Institute for Research on Poverty. Retrieved 27 September 2017.
- "Poverty Guidelines". ASPE. U.S. Department of Health and Human Services. 23 November 2015. Retrieved 27 September 2017.
- Bureau, US Census. "Income and Poverty in the United States: 2016". www.census.gov. Retrieved 27 September 2017.
- "What are Poverty Thresholds and Poverty Guidelines? | Institute for Research on Poverty | University of Wisconsin–Madison". www.irp.wisc.edu. Institute for Research on Poverty.
- "What are Poverty Thresholds and Poverty Guidelines? | Institute for Research on Poverty | University of Wisconsin–Madison". www.irp.wisc.edu. Institute for Research on Poverty.
- Semega, Jessica L.; Fontenot, Kayla R; Kollar, Melissa A. (September 2017). "Income and Poverty in the United States: 2016" (PDF). Census.gov. p. 18. Retrieved 27 September 2017.
- Semega, Jessica L.; Fontenot, Kayla R; Kollar, Melissa A. (September 2017). "Income and Poverty in the United States: 2016" (PDF). Census.gov. p. 18. Retrieved 27 September 2017.
- Semega, Jessica L.; Fontenot, Kayla R; Kollar, Melissa A. (September 2017). "Income and Poverty in the United States: 2016" (PDF). Census.gov. p. 18. Retrieved 27 September 2017.
- Semega, Jessica L.; Fontenot, Kayla R; Kollar, Melissa A. (September 2017). "Income and Poverty in the United States: 2016" (PDF). Census.gov. p. 18. Retrieved 27 September 2017.