Hurricane Daisy (1962)
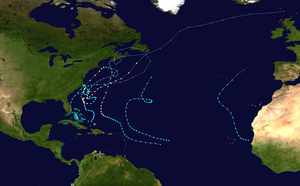
Hurricane Daisy brought the worst flooding to New England since Hurricane Diane in 1955. The fourth named storm and second hurricane of the 1962 Atlantic hurricane season, Daisy developed from a tropical disturbance located well east of the Leeward Islands on September 29. Initially a tropical depression, it headed west-northwestward and failed to strengthen significantly. While located a short distance from the Leeward Islands, the depression curved northwestward and began intensifying. On October 2, the depression was upgraded to Tropical Storm Daisy. Around that time, the storm turned back to the west-northwest and continued to deepen. Daisy reached hurricane status late on October 3. Two days later, it became a Category 2 hurricane on the Saffir–Simpson hurricane wind scale, but briefly weakened back to a Category 1 on October 6.
| Category 2 hurricane (SSHWS/NWS) | |
 Hurricane Daisy near peak strength | |
| Formed | September 29, 1962 |
|---|---|
| Dissipated | October 8, 1962 |
| Highest winds | 1-minute sustained: 105 mph (165 km/h) |
| Lowest pressure | 963 mbar (hPa); 28.44 inHg |
| Fatalities | 8 direct, 24 indirect |
| Damage | $1.1 million (1962 USD) |
| Areas affected | New England, Canadian Maritimes |
| Part of the 1962 Atlantic hurricane season | |
Daisy re-strengthened into a Category 2 later on October 6, and peaked with winds of 110 mph (175 km/h). The outer bands of Daisy produced strong winds and heavy surf in Bermuda, but caused no damage. It weakened back to a Category 1 again on October 7. While passing offshore New England, the storm, combined with a nor'easter, produced flooding and strong winds. Two fatalities were directly related to the hurricane, and 24 other people died in traffic related deaths, that were caused by slick roads from the heavy rain. Total damage in New England was estimated to be over $1.1 million (1962 USD). Early on October 8, Daisy made landfall near Yarmouth, Nova Scotia, several hours before transitioning into an extratropical cyclone. In Atlantic Canada, the storm brought rough seas, causing coastal flooding and six fatalities in Nova Scotia.
Meteorological history

A Television Infrared Observation Satellite (TIROS) revealed the presence of a tropical disturbance east of the Leeward Islands on September 28.[1] A reconnaissance aircraft flight into a system on the following day indicated that a tropical depression developed near 14.5°N, 48.9°W. The depression initially moved west-northwestward and remained disorganized for several days. In the early stages of the depression, the system appeared to have been located under minor vortices in the upper atmosphere, located within a strong east–to–west oriented trough.[2] Approaching the Lesser Antilles, the system curved northwestward between two high pressure areas on September 30 and avoided landfall in the islands.[2][3] By October 2, the depression strengthened into Tropical Storm Daisy. The trough dissipated on the following day, causing Daisy to resume its initial west-northwest motion. The storm intensified into a Category 1 hurricane later on October 3.[2][3] Further deepening occurred, and by October 5, Daisy became a Category 2 hurricane.[3]
A nor'easter off the East Coast of the United States caused Daisy to curve northward on October 5. The storm briefly weakened to a Category 1 hurricane on October 6. Six hours later, it re-strengthened to a Category 2 hurricane; Daisy also attained its minimum barometric pressure of 965 mbar (28.5 inHg). Late on October 6, maximum sustained winds reached 110 mph (175 km/h), the highest in relation to the system.[3] Daisy absorbed the nor'easter on October 6, after it weakened. Thereafter, Daisy began accelerating and cold sea surface temperatures weakened the storm back to a Category 1 hurricane on October 7.[3].[4] It briefly curved north-northwestward, before sharply turning east-northeastward in the Gulf of Maine. Early on October 8, Daisy made landfall near Yarmouth, Nova Scotia with winds of 75 mph (120 km/h). Several hours later, the storm transitioned into an extratropical cyclone. The remnants of Daisy re-emerged into the Atlantic Ocean and headed east-northeastward before dissipating south of Newfoundland on October 9.[3]
Preparations
Upon becoming a tropical cyclone, hurricane watches and gale warnings were issued for the Leeward Islands. As Daisy intensified, moved northward, and threatened New England, gale warnings were issued for the coastal areas from Block Island, Rhode Island, to Eastport, Maine, while hurricane watches were issued for the east coast of Maine.[5]
Impact
United States

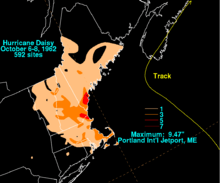
Damage totals from Daisy in the United States alone could surpass $10 million, including the passage of a nor'easter a day prior. Two fatalities were directly related to the storm, while 24 other people died from traffic related deaths due to flooded and slick roads.[2][6] Rainfall from the two systems caused record rainfall in some areas of Massachusetts, with 14.25 inches (362 mm) in Wakefield.[7] Some areas of Boston were under 1 foot (0.30 m) of water. The subways associated with the Massachusetts Bay Transportation Authority were flooded and could not be reopened until at least a day after the rain ceased.[8]
A total of 7.71 inches (196 mm) of precipitation fell in Portland, Maine within 24 hours, 3.13 inches (80 mm) of which fell in only 6 hours. Subsequently, Hurricane Daisy set a then-record the highest 24‑hour rainfall total for Portland; however, this recorded was broken during Hurricane Bob in 1991.[7] The overall rainfall total for Portland was 9.47 inches (0.241 m) at the international jetport.[1] In Auburn and Lewiston, a total of 4.58 inches (116 mm) of rain fell. The Androscoggin River overflowed and flooded a road in the former. Two fatalities were reported in Maine.[7] Throughout New England, thousands fled after homes, buildings, and school began to flood. It was considered the worst flood in the region since Hurricane Diane in 1955, and was caused partially because falling leaves clogged drains.[6]
Damages to boats were severe; hundreds of small boats were destroyed, while many larger boats were damaged.[9] In addition, the lobster industry suffered heavy losses from the system.[2] In the heavy surf that caused those damages to boats, three people were rescued in two different accidents, but they sustained injuries. Also, several small structures in Mount Desert Island, Maine were swept away by the high waves. In other areas of the New England coast, tides were 2 feet (0.61 m) above average; a person was swept away and drowned, and minor tidal flooding occurred in coastal areas.[9] In addition, a pier was washed away in the high surf.[4] Total damage from wave and tide was $600,000.[9] Some roads were completely under water, with pumping operations continuing for four days in the hardest hit locations.[6] Throughout Massachusetts, many roofs were blown off of houses.[9]
Strong winds were also reported in New England. The highest winds associated with Daisy were felt over coastal Maine, where winds of 70 mph (115 km/h) were commonly reported.[4] Wind damage was severe and widespread; one person in Maine was killed when a fallen tree landed on, and crushed his car while he was in it. In the southeastern portion of the state, power outages were reported, due to fallen trees and tree limbs. In addition, some roof shingles blown off in Maine and Massachusetts, while other houses were completely unroofed.[9] Daisy caused moderate to severe damage in eastern New England.[2][4] Total wind damage in New England was estimated to have reached $500,000.[9]
Elsewhere
During Daisy's track northward, it passed within 200 miles (320 km/h) of Bermuda, causing heavy surf, and up to 65 mph (105 km/h) winds.[10] Wind gusts up to 85 mph (137 km/h) disrupted telephone service in Nova Scotia. Waves of almost 15 feet (4.6 m) above normal in Shelburne smashed three fishing boats,[11] causing 16,000 CAD ($14,866, 1962 USD) in damage.[11][12] The government pier and building at Sandy Point were lost. Six people were swept into the ocean at Peggy's Cove and drowned. In Lockeport, waves washed sand across a highway. Rough seas in Newfoundland caused fishing boats to be crashed ashore in Seaforth. Strong winds were also reported in Prince Edward Island.[11]
See also
References
- David M. Roth (2008-01-20). Hurricane Daisy – October 6–8, 1962 (Report). Hydrometeorological Prediction Center. Retrieved 2013-03-05.
- Gordon E. Dunn (April 1963). The Hurricane Season of 1962 (PDF). United States Weather Bureau (Report). Atlantic Oceanographic and Meteorological Laboratory. pp. 205–207. Retrieved 2013-03-05.
- "Atlantic hurricane best track (HURDAT version 2)" (Database). United States National Hurricane Center. May 25, 2020.
- Edward Cable (1962-11-23). Hurricane Daisy – Effects on New England, October 5–7, 1962 (Report). National Hurricane Center. p. 1. Retrieved 2013-03-05.
- Hurricane Daisy, September 30 – October 7, 1962 (PDF). United States Weather Bureau (Report). National Oceanic and Atmospheric Administration. 1962-12-12. Retrieved 2013-03-05.
- Edward Sable (1962-11-23). Hurricane Daisy – Effects on New England, October 5–7, 1962 (Report). National Hurricane. p. 3. Retrieved 2013-03-05.
- Wayne Cotterly (1996). Hurricanes & Tropical Storms (PDF) (Report). Poland Emergency Management Agency. p. 76. Archived from the original (PDF) on 2016-04-01. Retrieved 2013-03-05.
- "Death, Destruction Follow Path of Hurricane Daisy". Rome News-Tribune. United Press International. 1962-10-08. p. 1. Retrieved 2013-03-05.
- Edward Cable (1962-11-23). Hurricane Daisy – Effects on New England, October 5–7, 1962 (Report). National Hurricane Center. p. 2. Retrieved 2013-03-05.
- Keith A. Forbes (2009-10-19). Bermuda Climate and Weather (Report). Bermuda-online.org. Retrieved 2013-03-05.
- 1962-Daisy (Report). Environment Canada. 2010-09-14. Retrieved 2013-03-05.
- Converter in the past (Report). FXTOP. Retrieved 2013-03-05.
