Fortune Bay-Cape La Hune
Fortune Bay—Cape La Hune is a provincial electoral district for the House of Assembly of Newfoundland and Labrador, Canada. When created in 1975 it was called Fortune-Hermitage. As of 2011, there are 6,053 eligible voters living within the district.[1]
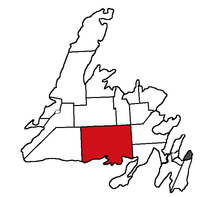 Fortune Bay-Cape La Hune in relation to other districts in Newfoundland | |||
| Provincial electoral district | |||
| Legislature | Newfoundland and Labrador House of Assembly | ||
| MHA |
Liberal | ||
| District created | 1975 | ||
| First contested | 1975 | ||
| Last contested | 2019 | ||
| Demographics | |||
| Population (2006) | 8,715 | ||
| Electors (2011) | 6,053 | ||
The district covers a larger section of Newfoundland's south coast. Includes territory east of Burgeo, and stretches to the end of Fortune Bay near the beginning of the Burin Peninsula. Includes such remote communities as Ramea, Francois, Conne and Gaultois. Also includes communities of Belleoram, Boxey, Coombs Cove, Conne River, Grey River, English Harbour West, Harbour Breton, Hermitage, McCallum, Milltown-Head of Bay d'Espoir, Morrisville, Mose Ambrose, Pool's Cove, Rencontre East, Samiajig Miaupukak (Conne River), St. Albans, St. Jacques, St. Joseph's Cove, St. Veronica's, Seal Cove and Tibbo's Hill.
Members of the House of Assembly
| Member | Party | Term | |
|---|---|---|---|
| Elvis Loveless | Liberal | 2019- | |
| Tracey Perry | Progressive Conservative | 2007-2019 | |
| Oliver Langdon | Prog. Cons./Independent/Liberal | 1989-2007 | |
| Roger Simmons | Liberal | 1985-1988 | |
| Don Stewart | Progressive Conservative | 1979-1985 | |
| Jack Winsor | Liberal | 1975-1979 | |
Hermitage
| Member | Party | Term | |
|---|---|---|---|
| Roy L. Cheeseman | Progressive Conservative | 1972-1975 | |
| Harold Piercey | Liberal | 1971-1972 | |
| Abel Wornell | Liberal | 1966-1971 | |
| John Cheeseman | Liberal | 1962-1966 | |
Fortune/Fortune Bay
| Member | Party | Term | |
|---|---|---|---|
| H.R.V. Earle | Progressive Conservative | 1972-1975 | |
| Augustus Oldford | Liberal | 1971-1972 | |
| H.R.V. Earle | Liberal | 1962-1971 | |
Fortune Bay and Hermitage
| Member | Party | Term | |
|---|---|---|---|
| John R. Courage | Liberal | 1949-1962 | |
Election results
| 2019 Newfoundland and Labrador general election | ||||||||
|---|---|---|---|---|---|---|---|---|
| Party | Candidate | Votes | % | ±% | ||||
| Liberal | Elvis Loveless | 1,759 | 53.41 | +15.8 | ||||
| Progressive Conservative | Charlene Walsh | 1,536 | 46.6 | -2.4 | ||||
| Total valid votes | 3,295 | 100 | ||||||
| Total rejected ballots | 17 | |||||||
| Turnout | 3,312 | 62.0 | -5.6 | |||||
| Eligible voters | 5,342 | |||||||
| 2015 Newfoundland and Labrador general election | ||||||||
|---|---|---|---|---|---|---|---|---|
| Party | Candidate | Votes | % | ±% | ||||
| Progressive Conservative | Tracey Perry | 1,830 | 49.04 | -18.24 | ||||
| Liberal | Bill Carter | 1,405 | 37.65 | +22.18 | ||||
| New Democratic | Mildred Skinner | 497 | 13.32 | -3.94 | ||||
| Total valid votes | 6,732 | 99.68 | ||||||
| Total rejected ballots | 12 | 0.32 | +0.01 | |||||
| Turnout | 3,744 | 67.61 | +4.15 | |||||
| Eligible voters | 5,538 | |||||||
| Progressive Conservative hold | Swing | -20.21 | ||||||
| 2011 Newfoundland and Labrador general election | ||||||||
|---|---|---|---|---|---|---|---|---|
| Party | Candidate | Votes | % | ±% | ||||
| Progressive Conservative | Tracey Perry | 2,592 | 67.27 | +4.08 | ||||
| New Democratic | Susan Skinner | 665 | 17.26 | +15.17 | ||||
| Liberal | Eric Skinner | 596 | 15.47 | -19.25 | ||||
| Total valid votes | 3,853 | 99.69 | ||||||
| Total rejected ballots | 12 | 0.31 | ||||||
| Turnout | 3,865 | 63.45 | ||||||
| Eligible voters | 6,091 | |||||||
| Party | Candidate | Votes | % | ± | |
|---|---|---|---|---|---|
| Progressive Conservative | Tracey Perry | 2,539 | 63.19% | – | |
| Liberal | Elvis Loveless | 1,395 | 34.72% | ||
| NDP | Sheldon Hynes | 84 | 2.09% | ||
| Party | Candidate | Votes | % | ± | |
|---|---|---|---|---|---|
| Liberal | Oliver Langdon | 2,880 | 58.79% | ||
| Progressive Conservative | Andrew Colford | 2,019 | 41.21% | – | |
| Party | Candidate | Votes | % | ± | |
|---|---|---|---|---|---|
| Liberal | Oliver Langdon | 3,189 | 69.9% | ||
| Progressive Conservative | Bob Baker | 1,353 | 29.7% | – | |
References
- "Summary of Polling Divisions FORTUNE BAY - CAPE LA HUNE" (PDF). Elections Newfoundland and Labrador. 3 August 2011. Retrieved 14 September 2011.
- Newfoundland & Labrador Votes 2007. Canadian Broadcasting Corporation. Retrieved May 22, 2009.