Labrador West (electoral district)
Labrador West is a provincial electoral district for the House of Assembly of Newfoundland and Labrador, Canada. From 1975 to 1996, the district was known as Menihek.
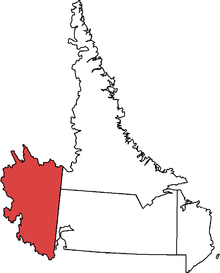 Labrador West in relation to other districts in Labrador | |||
| Provincial electoral district | |||
| Legislature | Newfoundland and Labrador House of Assembly | ||
| MHA |
New Democratic | ||
| District created | 1962 | ||
| First contested | 1962 | ||
| Last contested | 2019 | ||
| Demographics | |||
| Population (2011) | 9,238 | ||
| Electors (2015) | 6,202 | ||
| Area (km²) | 60,350 | ||
| Census divisions | Division No. 10 | ||
| Census subdivisions | Labrador City, Wabush, Division No. 10, Subd. D | ||
Known as the iron ore capital of Canada with two modern mining communities, Labrador City and Wabush, the district has a strong base of labour support. This district was the first in Newfoundland and Labrador to send a New Democratic member to the House of Assembly, electing party leader Peter Fenwick in a 1984 by-election. The NDP regained the seat in 2019 election.
Members of the House of Assembly
The district has elected the following Members of the House of Assembly:
| Assembly | Years | Member | Party | |
|---|---|---|---|---|
| Labrador West | ||||
| 33rd | 1962-1966 | Charles Devine | Independent | |
| 34th | 1966-1969 | Thomas W. Burgess | Liberal | |
| 1969-1971 | Labrador Party | |||
| 35th | 1972 | |||
| 1972 | Liberal | |||
| 36th | 1972-1975 | Joseph G. Rousseau | Progressive Conservative | |
| Menihek | ||||
| 37th | 1975-1979 | Joseph G. Rousseau | Progressive Conservative | |
| 38th | 1979-1982 | Peter J. Walsh | Progressive Conservative | |
| 39th | 1982-1984 | |||
| 1984-1985 | Peter Fenwick | New Democratic | ||
| 40th | 1985-1989 | |||
| 41st | 1989-1993 | Alec Snow | Progressive Conservative | |
| 42nd | 1993-1996 | |||
| Labrador West | ||||
| 43rd | 1996-1999 | Perry Canning | Liberal | |
| 44th | 1999-2003 | Randy Collins | New Democratic | |
| 45th | 2003-2007 | |||
| 2007 | Jim Baker | Progressive Conservative | ||
| 46th | 2007-2011 | |||
| 47th | 2011-2015 | Nick McGrath | Progressive Conservative | |
| 48th | 2015-2019 | Graham Letto | Liberal | |
| 49th | 2019–present | Jordan Brown | New Democratic | |
Election results
| 2019 Newfoundland and Labrador general election | ||||||||
|---|---|---|---|---|---|---|---|---|
| Party | Candidate | Votes | % | ±% | ||||
| New Democratic | Jordan Brown | 1,364 | 42.16 | +7.43 | ||||
| Liberal | Graham Letto | 1,362 | 42.10 | -1.70 | ||||
| Progressive Conservative | Derick Sharron | 509 | 15.73 | -5.73 | ||||
| Total valid votes | 3,235 | |||||||
| Total rejected ballots | ||||||||
| Turnout | ||||||||
| Eligible voters | ||||||||
| New Democratic gain from Liberal | Swing | +4.57 | ||||||
| These results were subject to a recount, where Brown's lead was reduced from four votes to two. | ||||||||
| 2015 Newfoundland and Labrador general election | ||||||||
|---|---|---|---|---|---|---|---|---|
| Party | Candidate | Votes | % | ±% | ||||
| Liberal | Graham Letto | 1,453 | 43.81 | +27.42 | ||||
| New Democratic | Ron Barron | 1,152 | 34.73 | +2.06 | ||||
| Progressive Conservative | Nick McGrath | 712 | 21.46 | -29.48 | ||||
| Total valid votes | 3,317 | 99.58 | – | |||||
| Total rejected ballots | 14 | 0.42 | – | |||||
| Turnout | 3,331 | 53.71 | -3.33 | |||||
| Eligible voters | 6,202 | |||||||
| Liberal gain from Progressive Conservative | Swing | +14.74 | ||||||
| Source: Elections Newfoundland and Labrador[1] | ||||||||
| 2011 Newfoundland and Labrador general election | ||||||||
|---|---|---|---|---|---|---|---|---|
| Party | Candidate | Votes | % | ±% | ||||
| Progressive Conservative | Nick McGrath | 1,843 | 50.94 | +0.14 | ||||
| New Democratic | Tom Harris | 1,182 | 32.67 | -9.92 | ||||
| Liberal | Karen Oldford | 593 | 16.39 | +9.78 | ||||
| Total valid votes | 3,618 | 99.72 | – | |||||
| Total rejected ballots | 10 | 0.28 | – | |||||
| Turnout | 3,628 | 57.04 | -11.33 | |||||
| Eligible voters | 6,360 | |||||||
| Progressive Conservative hold | Swing | +5.03 | ||||||
| Source: Elections Newfoundland and Labrador[2] | ||||||||
| 2007 Newfoundland and Labrador general election | ||||||||
|---|---|---|---|---|---|---|---|---|
| Party | Candidate | Votes | % | ±% | ||||
| Progressive Conservative | Jim Baker | 2,204 | 50.80 | +9.18 | ||||
| New Democratic | Darrel J. Brenton | 1,848 | 42.59 | +11.62 | ||||
| Liberal | Karen Oldford | 287 | 6.61 | -4.06 | ||||
| Total valid votes | 4,339 | 99.79 | – | |||||
| Total rejected ballots | 9 | 0.21 | – | |||||
| Turnout | 4,348 | 68.37 | +18.28 | |||||
| Eligible voters | 6,360 | |||||||
| Progressive Conservative hold | Swing | +10.40 | ||||||
| Source: Elections Newfoundland and Labrador[3] | ||||||||
| Newfoundland and Labrador provincial by-election, March 13, 2007 upon the resignation of Randy Collins | ||||||||
|---|---|---|---|---|---|---|---|---|
| Party | Candidate | Votes | % | ±% | ||||
| Progressive Conservative | Jim Baker | 1,666 | 41.62 | +18.59 | ||||
| New Democratic | Darrel J. Brenton | 1,240 | 30.97 | -24.74 | ||||
| Labrador | Ron Barron | 670 | 16.74 | +4.01 | ||||
| Liberal | Karen Oldford | 427 | 10.67 | +2.14 | ||||
| Total valid votes | 4,003 | 99.80 | – | |||||
| Total rejected ballots | 8 | 0.20 | – | |||||
| Turnout | 4,011 | 50.09 | -10.90 | |||||
| Eligible voters | 8,008 | |||||||
| Progressive Conservative gain from New Democratic | Swing | +21.67 | ||||||
| Source: Elections Newfoundland and Labrador[4] | ||||||||
| 2003 Newfoundland and Labrador general election | ||||||||
|---|---|---|---|---|---|---|---|---|
| Party | Candidate | Votes | % | ±% | ||||
| New Democratic | Randy Collins | 2,762 | 55.71 | +7.87 | ||||
| Progressive Conservative | Graham Letto | 1,142 | 23.03 | +15.94 | ||||
| Labrador | Ern Condon | 631 | 12.73 | +12.73 | ||||
| Liberal | Doris Sacrey | 423 | 8.53 | -36.54 | ||||
| Total valid votes | 4,958 | 99.80 | – | |||||
| Total rejected ballots | 10 | 0.20 | – | |||||
| Turnout | 4,968 | 60.99 | -6.85 | |||||
| Eligible voters | 8,145 | |||||||
| New Democratic hold | Swing | +11.91 | ||||||
| Source: Elections Newfoundland and Labrador[5] | ||||||||
| 1999 Newfoundland and Labrador general election | ||||||||
|---|---|---|---|---|---|---|---|---|
| Party | Candidate | Votes | % | ±% | ||||
| New Democratic | Randy Collins | 2,700 | 47.84 | +47.84 | ||||
| Liberal | Perry Canning | 2,544 | 45.07 | -16.69 | ||||
| Progressive Conservative | Susan Whitten | 400 | 7.09 | -31.15 | ||||
| Total valid votes | 5,644 | 99.68 | – | |||||
| Total rejected ballots | 18 | 0.32 | – | |||||
| Turnout | 5,662 | 67.84 | -5.57 | |||||
| Eligible voters | 8,346 | |||||||
| New Democratic gain from Liberal | Swing | +32.27 | ||||||
| Source: Elections Newfoundland and Labrador[6] | ||||||||
| 1996 Newfoundland and Labrador general election | ||||||||
|---|---|---|---|---|---|---|---|---|
| Party | Candidate | Votes | % | ±% | ||||
| Liberal | Perry Canning | 3,457 | 61.76 | +15.76 | ||||
| Progressive Conservative | Alec Snow | 2,140 | 38.24 | -11.74 | ||||
| Total valid votes | 5,597 | 99.77 | – | |||||
| Total rejected ballots | 13 | 0.23 | – | |||||
| Turnout | 5,610 | 73.41 | +0.74 | |||||
| Eligible voters | 7,642 | |||||||
| Liberal gain from Progressive Conservative | Swing | +13.75 | ||||||
| Source: Elections Newfoundland and Labrador[7] | ||||||||
| 1993 Newfoundland and Labrador general election | ||||||||
|---|---|---|---|---|---|---|---|---|
| Party | Candidate | Votes | % | ±% | ||||
| Progressive Conservative | Alec Snow | 3,086 | 49.98 | -3.17 | ||||
| Liberal | Perry Canning | 2,840 | 46.00 | +5.47 | ||||
| New Democratic | Ruth Larson | 248 | 4.02 | -2.30 | ||||
| Total valid votes | 6,174 | 99.74 | – | |||||
| Total rejected ballots | 16 | 0.26 | – | |||||
| Turnout | 6,190 | 72.67 | -14.35 | |||||
| Eligible voters | 8,518 | |||||||
| Progressive Conservative hold | Swing | -4.32 | ||||||
| Source: Elections Newfoundland and Labrador[8] | ||||||||
| 1989 Newfoundland and Labrador general election | ||||||||
|---|---|---|---|---|---|---|---|---|
| Party | Candidate | Votes | % | ±% | ||||
| Progressive Conservative | Alec Snow | 3,004 | 53.15 | +7.76 | ||||
| Liberal | Bill Kelly | 2,291 | 40.53 | +35.33 | ||||
| New Democratic | Nelson Larson | 357 | 6.32 | -43.09 | ||||
| Total valid votes | 5,652 | 99.86 | – | |||||
| Total rejected ballots | 8 | 0.14 | – | |||||
| Turnout | 5,660 | 87.02 | -3.80 | |||||
| Eligible voters | 6,504 | |||||||
| Progressive Conservative gain from New Democratic | Swing | +21.55 | ||||||
| Source: Elections Newfoundland and Labrador[9] | ||||||||
| 1985 Newfoundland and Labrador general election | ||||||||
|---|---|---|---|---|---|---|---|---|
| Party | Candidate | Votes | % | ±% | ||||
| New Democratic | Peter Fenwick | 2,841 | 49.41 | +9.09 | ||||
| Progressive Conservative | Alec Snow | 2,610 | 45.39 | +6.45 | ||||
| Liberal | Andrew Spracklin | 299 | 5.20 | -15.54 | ||||
| Total valid votes | 5,750 | 99.71 | – | |||||
| Total rejected ballots | 17 | 0.29 | – | |||||
| Turnout | 5,767 | 90.82 | +31.99 | |||||
| Eligible voters | 6,350 | |||||||
| New Democratic hold | Swing | +7.77 | ||||||
| Source: Elections Newfoundland and Labrador[10] | ||||||||
| Newfoundland and Labrador provincial by-election, October 9, 1984 upon the resignation of Peter J. Walsh | ||||||||
|---|---|---|---|---|---|---|---|---|
| Party | Candidate | Votes | % | ±% | ||||
| New Democratic | Peter Fenwick | 1,744 | 40.32 | +26.02 | ||||
| Progressive Conservative | Alec Snow | 1,684 | 38.94 | -19.91 | ||||
| Liberal | Danny Dumaresque | 897 | 20.74 | -6.11 | ||||
| Total valid votes | 4,325 | 99.77 | – | |||||
| Total rejected ballots | 10 | 0.23 | – | |||||
| Turnout | 4,335 | 58.83 | -24.09 | |||||
| Eligible voters | 7,369 | |||||||
| New Democratic gain from Progressive Conservative | Swing | +22.97 | ||||||
| Source: Elections Newfoundland and Labrador[11] | ||||||||
| 1982 Newfoundland and Labrador general election | ||||||||
|---|---|---|---|---|---|---|---|---|
| Party | Candidate | Votes | % | ±% | ||||
| Progressive Conservative | Peter J. Walsh | 3,589 | 58.85 | +23.35 | ||||
| Liberal | Gordon C. Manstan | 1,637 | 26.85 | -7.01 | ||||
| New Democratic | Roland LeGrow | 872 | 14.30 | -16.34 | ||||
| Total valid votes | 6,098 | 99.80 | – | |||||
| Total rejected ballots | 12 | 0.20 | – | |||||
| Turnout | 6,110 | 82.92 | +11.45 | |||||
| Eligible voters | 7,369 | |||||||
| Progressive Conservative hold | Swing | +15.18 | ||||||
| Source: Elections Newfoundland and Labrador[12] | ||||||||
| 1979 Newfoundland and Labrador general election | ||||||||
|---|---|---|---|---|---|---|---|---|
| Party | Candidate | Votes | % | ±% | ||||
| Progressive Conservative | Peter J. Walsh | 1,862 | 35.50 | -29.50 | ||||
| Liberal | Gordon C. Manstan | 1,776 | 33.86 | +18.10 | ||||
| New Democratic | Nelson Larson | 1,607 | 30.64 | +22.42 | ||||
| Total valid votes | 5,245 | 99.62 | – | |||||
| Total rejected ballots | 20 | 0.38 | – | |||||
| Turnout | 5,265 | 71.45 | +21.06 | |||||
| Eligible voters | 7,369 | |||||||
| Progressive Conservative hold | Swing | -23.80 | ||||||
| Source: Elections Newfoundland and Labrador[13] | ||||||||
| 1975 Newfoundland general election | ||||||||
|---|---|---|---|---|---|---|---|---|
| Party | Candidate | Votes | % | ±% | ||||
| Progressive Conservative | Joseph G. Rousseau | 2,561 | 65.00 | +4.16 | ||||
| Liberal | Eric Phillip Chaulk | 621 | 15.76 | -15.77 | ||||
| Reform Liberal | Eugene William Canning | 434 | 11.02 | +11.02 | ||||
| New Democratic | William James Smeaton | 324 | 8.22 | +8.22 | ||||
| Total valid votes | 3,940 | 99.67 | – | |||||
| Total rejected ballots | 13 | 0.33 | – | |||||
| Turnout | 3,953 | 50.39 | -42.60 | |||||
| Eligible voters | 7,845 | |||||||
| Progressive Conservative hold | Swing | +9.97 | ||||||
| Source: Elections Newfoundland and Labrador[14] | ||||||||
| 1972 Newfoundland general election | ||||||||
|---|---|---|---|---|---|---|---|---|
| Party | Candidate | Votes | % | ±% | ||||
| Progressive Conservative | Joseph G. Rousseau | 3,494 | 60.84 | |||||
| Liberal | Thomas W. Burgess | 1,811 | 31.53 | |||||
| Labrador | Gerald Thomas Neary | 438 | 7.63 | |||||
| Total valid votes | 5,743 | 99.19 | – | |||||
| Total rejected ballots | 14 | 0.81 | – | |||||
| Turnout | 5,757 | 92.99 | ||||||
| Eligible voters | 6,191 | |||||||
| Progressive Conservative gain from Liberal | Swing | – | ||||||
| Source: Elections Newfoundland and Labrador[15] | ||||||||
gollark: Also, it literally just runs lua you send, so it may need modification to be useful.
gollark: <@168410986032660480>
gollark: Because ECC is slow in CC, by the way, there's a 0.5 second delay before you get a response back from the clients of the notswarm.
gollark: No modem required!
gollark: It should run under CCEmuX, I think.
See also
- 2007 Labrador West provincial by-election
- Ern Condon
- Labrador Party
- New Democratic Party of Newfoundland and Labrador
References
- "2015 Provincial General Election Report" (PDF). Elections Newfoundland and Labrador. 25 July 2016. Archived from the original (PDF) on 18 July 2017. Retrieved 21 November 2018.
- "Report on the Provincial General Election, October 11, 2011" (PDF). Office of the Chief Electoral Officer of Newfoundland and Labrador. 8 June 2012. Archived from the original (PDF) on 4 March 2016. Retrieved 21 November 2018.
- "Report on the Provincial General Election, October 9, 2007" (PDF). Office of the Chief Electoral Officer of Newfoundland and Labrador. 7 July 2008. Archived from the original (PDF) on 20 October 2016. Retrieved 21 November 2018.
- "Report of the Chief Electoral Officer on the Labrador West By-Election, March 13, 2007" (PDF). Office of the Chief Electoral Officer of Newfoundland and Labrador. 2 July 2007. Retrieved 24 December 2018.
- "Report on the October 21, 2003 General Election" (PDF). Office of the Chief Electoral Officer of Newfoundland and Labrador. 9 July 2004. Archived from the original (PDF) on 4 March 2016. Retrieved 21 November 2018.
- "Report of the Chief Electoral Officer on the General Election for the Forty-Fourth General Assembly, February 9, 1999" (PDF). Office of the Chief Electoral Officer of Newfoundland and Labrador. 9 November 1999. Archived from the original (PDF) on 28 November 2015. Retrieved 21 November 2018.
- "Report of the Chief Electoral Officer on the General Election for the Forty-Third General Assembly, February 22, 1996" (PDF). Office of the Chief Electoral Officer of Newfoundland and Labrador. 28 October 1996. Archived from the original (PDF) on 28 November 2015. Retrieved 21 November 2018.
- "Report of the Chief Electoral Officer on the General Election for the Forty-Second General Assembly, May 3, 1993" (PDF). Office of the Chief Electoral Officer of Newfoundland and Labrador. 1994. Archived from the original (PDF) on 28 November 2015. Retrieved 21 November 2018.
- "Election Statistics 1989" (PDF). Office of the Chief Electoral Officer of Newfoundland and Labrador. 1989. Archived from the original (PDF) on 4 March 2016. Retrieved 21 November 2018.
- "Election Returns 1985" (PDF). Office of the Chief Electoral Officer of Newfoundland and Labrador. 22 October 1985. Archived from the original (PDF) on 4 March 2016. Retrieved 21 November 2018.
- "Election Statistics 1984" (PDF). Office of the Chief Electoral Officer of Newfoundland and Labrador. Retrieved 24 December 2018.
- "Election Returns 1982" (PDF). Office of the Chief Electoral Officer of Newfoundland and Labrador. 25 August 1982. Archived from the original (PDF) on 23 November 2015. Retrieved 21 November 2018.
- "Election Returns 1979" (PDF). Office of the Chief Electoral Officer of Newfoundland and Labrador. 12 October 1979. Archived from the original (PDF) on 4 March 2016. Retrieved 22 November 2018.
- "Election Returns 1975" (PDF). Office of the Chief Electoral Officer of Newfoundland and Labrador. 30 April 1976. Archived from the original (PDF) on 23 November 2015. Retrieved 22 November 2018.
- "General Election Returns, March 24, 1972" (PDF). Office of the Chief Electoral Officer of Newfoundland and Labrador. 1973. Archived from the original (PDF) on 5 March 2016. Retrieved 22 November 2018.
External links
This article is issued from Wikipedia. The text is licensed under Creative Commons - Attribution - Sharealike. Additional terms may apply for the media files.