Ferryland (electoral district)
Ferryland is a provincial electoral district for the House of Assembly of Newfoundland and Labrador, Canada. As of 2011, there are 8,571 eligible voters living within the district.[1]
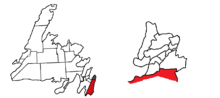 Ferryland in relation to other districts in Newfoundland (left) and St. John's (right). | |||
| Provincial electoral district | |||
| Legislature | Newfoundland and Labrador House of Assembly | ||
| MHA |
Progressive Conservative | ||
| District created | 1949 | ||
| First contested | 1949 | ||
| Last contested | 2019 | ||
| Demographics | |||
| Population (2011) | 14,007 | ||
| Electors (2015) | 9,981 | ||
| Area (km²) | 2,800 | ||
| Census divisions | Division No. 1 | ||
| Census subdivisions | Aquaforte, Bay Bulls, Cape Broyle, Fermeuse, Ferryland, Petty Harbour–Maddox Cove, Port Kirwan, Portugal Cove South, Renews–Cappahayden, St. John's (part), St. Shott's, Trepassey, Witless Bay, Division No. 1, Subd. D, Division No. 1, Subd. U, Division No. 1, Subd. V | ||
This was the most strongly anti-Confederation area of the province in the late 1940s, but turned Liberal in the 1950s and 1960s. It is historically a fishing district, but tourism has been growing. Ferryland contains part of the City of St. John's in the area of Lower Goulds as well as the communities of: Admiral's Cove, Aquaforte, Bay Bulls, Bauline East, Biscay Bay, Brigus South, Burnt Cove, Calvert, Cape Broyle, Cappahayden, Daniel's Point, Fermeuse, Ferryland, Kingman's Cove, La Manche, Mobile, Petty-Harbour-Maddox Cove, Port Kirwan, Portugal Cove South, Renews, St. Michael's, St. Shotts, Tors Cove, Trepassey and Witless Bay.
Bordering districts include Conception Bay South, Harbour Main, Mount Pearl-Southlands, Placentia-St. Mary's and Waterford Valley.
Members of the House of Assembly
The district has elected the following Members of the House of Assembly:[2]
| Assembly | Years | Member | Party | |
|---|---|---|---|---|
| 29th | 1949–1951 | Peter John Cashin | Independent | |
| 1951 | Progressive Conservative | |||
| 30th | 1951–1952 | Augustine Michael Duffy | Progressive Conservative | |
| 1952–1956 | Myles Murray | Liberal | ||
| 31st | 1956-1959 | |||
| 32nd | 1959-1962 | |||
| 33rd | 1962-1966 | |||
| 34th | 1966-1971 | Aiden Joseph Maloney | Liberal | |
| 35th | 1971-1972 | Thomas Mershon Doyle | Progressive Conservative | |
| 36th | 1972-1975 | |||
| 37th | 1975-1979 | Charles J. Power | Progressive Conservative | |
| 38th | 1979-1982 | |||
| 39th | 1982-1985 | |||
| 40th | 1985-1989 | |||
| 41st | 1989-1992 | |||
| 1992-1993 | Loyola Sullivan | Progressive Conservative | ||
| 42nd | 1993-1996 | |||
| 43rd | 1996-1999 | |||
| 44th | 1999-2003 | |||
| 45th | 2003-2006 | |||
| 2007 | Keith Hutchings | Progressive Conservative | ||
| 46th | 2007-2011 | |||
| 47th | 2011-2015 | |||
| 48th | 2015-2019 | |||
| 49th | 2019–Present | Loyola O'Driscoll | Progressive Conservative | |
Election results
| 2019 Newfoundland and Labrador general election | ||||||||
|---|---|---|---|---|---|---|---|---|
| Party | Candidate | Votes | % | ±% | ||||
| Progressive Conservative | Loyola O'Driscoll | 4,074 | 60.6 | +10.8 | ||||
| Liberal | Janice Ryan | 2,350 | 34.9 | -6.2 | ||||
| Independent | Chris Molloy | 300 | 4.5 | – | ||||
| Total valid votes | 6,724 | 100 | ||||||
| Total rejected ballots | 52 | |||||||
| Turnout | 6,776 | 69.3 | +7.0 | |||||
| Eligible voters | 9,782 | |||||||
| 2015 Newfoundland and Labrador general election | ||||||||
|---|---|---|---|---|---|---|---|---|
| Party | Candidate | Votes | % | |||||
| Progressive Conservative | Keith Hutchings | 3,093 | 49.83 | |||||
| Liberal | Jeff Marshall | 2,550 | 41.08 | |||||
| New Democratic | Mona Rossiter | 564 | 9.09 | |||||
| Total valid votes | 6,207 | 99.82 | ||||||
| Total rejected ballots | 11 | 0.18 | ||||||
| Turnout | 6,218 | 62.30 | ||||||
| Eligible voters | 9,981 | |||||||
| Source: Elections Newfoundland and Labrador[3] | ||||||||
| Party | Candidate | Votes | % | ± | |
|---|---|---|---|---|---|
| Progressive Conservative | Keith Hutchings | 3,640 | 72.15 | -11.65 | |
| NDP | Chris Molloy | 1.224 | 24.26 | +17.35 | |
| Liberal | Dianne Randell | 181 | 3.59 | -5.7 | |
| Party | Candidate | Votes | % | ± | |
|---|---|---|---|---|---|
| Progressive Conservative | Keith Hutchings | 4,256 | 83.8% | +8.7% | |
| Liberal | Kevin Bennett | 472 | 9.29% | -10.9% | |
| NDP | Grace Bavington | 351 | 6.91% | +1.95% | |
| Party | Candidate | Votes | % | ± | |
|---|---|---|---|---|---|
| Progressive Conservative | Keith Hutchings | 2,770 | 75.10% | -11.24% | |
| Liberal | Kevin Bennett | 715 | 19.38% | +10.97% | |
| NDP | Rick Boland | 183 | 4.96% | -0.19% | |
| Party | Candidate | Votes | % | ± | |
|---|---|---|---|---|---|
| Progressive Conservative | Loyola Sullivan | 5,167 | 86.34 | – | |
| Liberal | Andrea Kavanagh | 504 | 8.41 | ||
| NDP | Lois Martin | 309 | 5.15 | ||
| Independent | Pilar Riego-Hickey | 11 | 0.18 | ||
| Party | Candidate | Votes | % | ± | |
|---|---|---|---|---|---|
| Progressive Conservative | Loyola Sullivan | 4,482 | 66.0% | – | |
| Liberal | Harold Mulloney | 2,141 | 31.5% | ||
| NDP | Gerry Ryan | 147 | 2.2% | ||
| Party | Candidate | Votes | % | ± | |
|---|---|---|---|---|---|
| Progressive Conservative | L Sullivan | 4834 | 68.36% | – | |
| Liberal | T Best | 2237 | 31.63% | ||
| Party | Candidate | Votes | % | ± | |
|---|---|---|---|---|---|
| Progressive Conservative | L Sullivan | 3675 | 74.00% | – | |
| Liberal | MC O'Brien | 1125 | 22.65% | ||
| NDP | V Silk | 166 | 0.32% | ||
References
- "Summary of Polling Divisions FERRYLAND" (PDF). Elections Newfoundland and Labrador. 3 August 2011. Retrieved 14 September 2011.
- Encyclopedia of Newfoundland and Labrador
- "2015 Provincial General Election Report" (PDF). Elections Newfoundland and Labrador. 25 July 2016. Retrieved 16 May 2019.
- Newfoundland & Labrador Votes 2007. Canadian Broadcasting Corporation. Retrieved May 22, 2009.
- Ferryland byelection February 8, 2007 Archived July 6, 2011, at the Wayback Machine
- Newfoundland & Labrador Votes 1996 Archived 2011-08-07 at the Wayback Machine. Elections Newfoundland and Labrador. Retrieved 2011-04-03.
- Newfoundland & Labrador Votes 1993 Archived 2011-07-06 at the Wayback Machine. Elections Newfoundland and Labrador. Retrieved 2011-04-03.