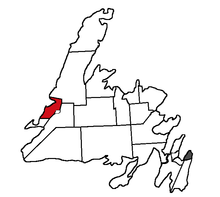
Humber-Bay of Islands
Humber-Bay of Islands is a provincial electoral district for the House of Assembly of Newfoundland and Labrador, Canada. As of 2015, the district has 13,412 eligible voters.[1]
 Humber-Bay of Islands in relation to other district in Newfoundland | |||
| Provincial electoral district | |||
| Legislature | Newfoundland and Labrador House of Assembly | ||
| MHA |
Independent | ||
| District created | 1975 | ||
| First contested | 1975 | ||
| Last contested | 2019 | ||
| Demographics | |||
| Population (2006) | 9,936 | ||
| Electors (2015) | 13,412 | ||
It contains the towns of Irishtown, Hughes Brook, Summerside, Meadows, Gillams, McIvers, Cox's Cove, Mount Moriah, York Harbour, Lark Harbour, and Humber Arm South (Benoit's Cove, Frenchmen's Cove, Halfway Point, and Wood's Island).
While historically, the Curling area of Corner Brook was part of the district. The district was reconfigured in 2015 to include the Humbermouth area of the City of Corner Brook, while maintaining the north and south shores of the Bay of Islands and the Curling area of the city. The Humbermouth area of Corner Brook was previously included in the district of Humber East.
While not a wealthy district, Humber-Bay of Islands is more economically vibrant than other rural districts. Its economy is driven by the fishery and tourism, to a limited extent. Many residents work in Corner Brook.
This district was home to back-to-back premiers. Immediately after becoming leader of the Liberals, Brian Tobin chose this district, vacated by Clyde Wells. Former Liberal Cabinet Minister Eddie Joyce is currently MHA; he was re-elected as an Independent in 2019.
Members of the House of Assembly
The district has elected the following Members of the House of Assembly:
| Member | Party | Term | |
|---|---|---|---|
| Eddie Joyce | Independent | 2018- | |
| Liberal | 2015-2018 | ||
| Terry Loder | Progressive Conservative | 2007-2011 | |
| Eddie Joyce | Liberal | 1999-2007 | |
| Brian Tobin | Liberal | 1996-1999 | |
| Clyde Wells | Liberal | 1989-1995 | |
| Eddie Joyce | Liberal | 1989 | |
| Ted Blanchard | Progressive Conservative | 1985-1989 | |
| Luke Woodrow | Progressive Conservative | 1975-1985 |
Election results
Humber-Bay of Islands
| 2019 Newfoundland and Labrador general election | ||||||||
|---|---|---|---|---|---|---|---|---|
| Party | Candidate | Votes | % | ±% | ||||
| Independent | Eddie Joyce | 4,172 | 67.19 | – | ||||
| Liberal | Brian Dicks | 1,068 | 17.20 | -67.3 | ||||
| Progressive Conservative | Michael Patrick Holden | 659 | 10.61 | +0.3 | ||||
| New Democratic | Shawn A. Hodder | 310 | 4.99 | -0.2 | ||||
| Total valid votes | 6,209 | 100 | ||||||
| Total rejected ballots | 74 | |||||||
| Turnout | 6,283 | 62.7 | +10.0 | |||||
| Eligible voters | 10,028 | |||||||
| Independent gain from Liberal | Swing | +67.26 | ||||||
| 2015 Newfoundland and Labrador general election | ||||||||
|---|---|---|---|---|---|---|---|---|
| Party | Candidate | Votes | % | |||||
| Liberal | Eddie Joyce | 4,622 | 84.53 | |||||
| Progressive Conservative | Ronald Jesseau | 564 | 10.31 | |||||
| New Democratic | Conor Curtis | 282 | 5.16 | |||||
| Total valid votes | 5,468 | 99.54 | ||||||
| Total rejected ballots | 25 | 0.46 | ||||||
| Turnout | 5,493 | 52.75 | ||||||
| Eligible voters | 10,414 | |||||||
Bay of Islands
| 2011 Newfoundland and Labrador general election | ||||||||
|---|---|---|---|---|---|---|---|---|
| Party | Candidate | Votes | % | ±% | ||||
| Liberal | Eddie Joyce | 2,760 | 51.22 | +5.62 | ||||
| Progressive Conservative | Terry Loder | 2,003 | 37.18 | -15.25 | ||||
| New Democratic | Tony Adey | 625 | 11.60 | +9.63 | ||||
| Total valid votes | 5,388 | 99.66 | ||||||
| Total rejected ballots | 18 | 0.34 | ||||||
| Turnout | 5,406 | 69.98 | ||||||
| Electors on the lists | 7,725 | – | ||||||
| 2007 Newfoundland and Labrador general election | ||||||||
|---|---|---|---|---|---|---|---|---|
| Party | Candidate | Votes | % | ±% | ||||
| Progressive Conservative | Terry Loder | 2,854 | 52.43 | +3.00 | ||||
| Liberal | Eddie Joyce | 2,482 | 45.60 | -1.33 | ||||
| New Democratic | Charles Murphy | 107 | 1.97 | -1.67 | ||||
| Total valid votes | 5,444 | 99.63 | ||||||
| Total rejected ballots | 20 | 0.37 | ||||||
| Turnout | 5,464 | 73.45 | ||||||
| Electors on the lists | 7,439 | – | ||||||
| Party | Candidate | Votes | % | ± | |
|---|---|---|---|---|---|
| Liberal | Eddie Joyce | 2907 | 49.43 | -8.13 | |
| Progressive Conservative | Mike Monaghan | 2760 | 46.93 | +15.77 | |
| NDP | Dave (Bud) Quigley | 214 | 3.64 | -7.64 | |
| Party | Candidate | Votes | % | ± | |
|---|---|---|---|---|---|
| Liberal | Eddie Joyce | 3164 | 57.56 | -8.11 | |
| Progressive Conservative | Paul Hunt | 1713 | 31.16 | +3.69 | |
| NDP | Israel Hann | 620 | 11.28 | +4.43 | |
| Party | Candidate | Votes | % | ± | |
|---|---|---|---|---|---|
| Liberal | Brian Tobin | 3997 | 65.67 | ||
| Progressive Conservative | Paul Hunt | 1672 | 27.47 | – | |
| NDP | Hayward Pardy | 417 | 6.85 | ||
External links
References
- "Summary of Polling Divisions HUMBER-BAY OF ISLANDS" (PDF). Elections Newfoundland and Labrador. 3 August 2015. Retrieved 1 September 2017.