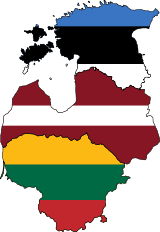
Baltic Tiger
Baltic Tiger is a term used to refer to any of the three Baltic states of Estonia, Latvia, and Lithuania during their periods of economic boom, which started after the year 2000 and continued until 2006–2007. The term is modeled on Four Asian Tigers, Tatra Tiger, and Celtic Tiger, which were used to describe the economic boom periods in parts of Asia, Slovakia, and Ireland, respectively.

.jpg)
Overview
Economically, parallel with the political changes, and the democratic transition, – as a rule of law states – the previous command economies were transformed via the legislation into market economies, and set up or renewed the major macroeconomic factors: budgetary rules, national audit, national currency, central bank Generally, they shortly encountered the following problems: high inflation, high unemployment, low economic growth and high government debt. The inflation rate, in the examined area, relatively quickly dropped to below 5% by 2000. Meanwhile, these economies were stabilized, and sooner or later between 2004 and 2013 all of them joined the European Union. New macroeconomic requirements have arisen for them; the Maastricht criteria became obligatory. Later the Stability and Growth Pact set stricter rules through national legislation by implementing e g the regulations and directives of the Sixpack, because the financial crisis was a shocking milestone.[1]
After 2000, the Baltic Tiger economies implemented important economic reforms and liberalisation, which, coupled with their fairly low-wage and skilled labour force, attracted large amounts of foreign investment and economic growth. Between 2000 and 2007, the Baltic Tiger states had the highest growth rates in Europe. In 2006, for example, Estonia grew by 10.3% in gross domestic product, while Latvia grew by 11.9% and Lithuania by 7.5%. All three countries by February 2006 saw their rates of unemployment falling below average EU values. Additionally, Estonia is among the ten most liberal economies in the world and in 2006 switched from being classified as an upper-middle income economy to a high-income economy by the World Bank. All three countries joined the European Union in May 2004. Estonia adopted the Euro in January 2011, Latvia in 2014 and Lithuania entered the Eurozone in 2015.
In 2008, the global financial crisis triggered the collapse of the Baltic property markets, causing some of the most severe recessions in Europe. In 2008, Latvia's GDP shrank by −4.6% and Estonia's −3.6% while Lithuania's slowed to 3.0%. As the crisis swept across Eastern and Central Europe the economic reversal intensified: Estonia's GDP dropped by -16.2% year-on-year, Latvia's by −19.6% and Lithuania's by −16.8%.[2] By mid-2009, all three countries experienced one of the deepest recessions in the world.[3]
In 2010 the economic situation in the Baltic states stabilized and in 2011 the Baltic states experienced the fastest recoveries in the European Union, after having lost a substantial part of their populations through emigration, particularly Lithuania. Estonia's GDP grew by 8.3% in 2011, Lithuania's GDP grew by 5.9% and Latvia's GDP by 5.5%.[4]
Statistics
Annual GDP growth rate
| 2004 | 2005 | 2006 | 2007 | 2008 | 2009 | 2010 | 2011 | 2012 | 2013 | 2014 | 2015 | 2016 | 2017 | 2018 | |
|---|---|---|---|---|---|---|---|---|---|---|---|---|---|---|---|
| Estonia | 6.3% | 9.4% | 10.3% | 7.7% | -5.4% | -14.7% | 2.3% | 7.6% | 4.3% | 1.9% | 2.9% | 1.9% | 3.6% | 4.9% | 3.9% |
| Latvia | 8.3% | 10.7% | 11.9% | 10.0% | -3.5% | -14.4% | -3.9% | 6.4% | 4.0% | 2.4% | 1.9% | 3.0% | 2.1% | 4.6% | 4.8% |
| Lithuania | 6.6% | 7.7% | 7.4% | 11.1% | 2.6% | -14.8% | 1.6% | 6.0% | 3.8% | 3.5% | 3.5% | 2.0% | 2.4% | 4.1% | 3.5% |
| Data from Eurostat | |||||||||||||||
GDP per capita
In current international dollars, at purchasing power parity (PPP). Numbers in brackets show the respective country's GDP per capita as a percentage of the eurozone average (also measured at PPP).
| 2000 | 2001 | 2002 | 2003 | 2004 | 2005 | 2006 | 2007 | 2008 | 2009 | 2010 | 2011* | 2012* | 2013* | 2014* | 2015* | 2016* | 2017* | 2018* | |
|---|---|---|---|---|---|---|---|---|---|---|---|---|---|---|---|---|---|---|---|
| Estonia | 12,113 (40.1%) |
13,254 (42.6%) |
14,371 (46.1%) |
15,839 (49.8%) |
17,413 (53.5%) |
19,765 (57.3%) |
22,600 (61.6%) |
25,144 (64.8%) |
24,329 (62.2%) |
20,946 (56.2%) |
21,721 (57.1%) |
20,657 | 21,713 | 22,731 | 23,917 | 25,219 | 26,654 | 28,203 | 29,871 |
| Latvia | 8,888 (30.9%) |
9,794 (33.0%) |
10,800 (35.8%) |
12,056 (38.8%) |
13,555 (42.1%) |
15,673 (46.3%) |
18,252 (50.6%) |
20,785 (54.6%) |
20,600 (53.3%) |
18,005 (46.7%) |
17,856 (46.4%) |
16,717 | 18,254 | 19,384 | 20,661 | 22,026 | 23,465 | 25,007 | 26,639 |
| Lithuania | 9,619 (34.4%) |
10,567 (36.3%) |
11,546 (38.8%) |
13,124 (43.0%) |
14,530 (45.6%) |
16,422 (49.3%) |
18,473 (52.0%) |
21,319 (56.1%) |
22,539 (58.1%) |
19,562 (52.2%) |
20,552 (53.0%) |
20,342 | 21,615 | 22,787 | 24,144 | 25,614 | 27,246 | 29,043 | 30,933 |
| * Data from the International Monetary Fund Report of 2013 (IMF staff estimates after 2013) | |||||||||||||||||||
See also
Economies of the Baltic Tigers:
Other 'Tigers'
References
- Vértesy, László (2018). "Macroeconomic Legal Trends in the EU11 Countries" (PDF). Public Governance, Administration and Finances Law Review. 3. No. 1. 2018. Archived from the original (PDF) on 2019-08-12. Retrieved 2019-08-12.
- "Latvia's Economy Contracted Record 19.6% Last Quarter (Update3)". Bloomberg. 2009-08-10.
- "November 16, 2009". The Nation. Retrieved 2013-05-03.
- "GDP of Latvia increased by 5.5% in 2011". The Baltic Course. 2012-03-09. Retrieved 2012-03-24.
