Webster County, West Virginia
Webster County is a county in the U.S. state of West Virginia. As of the 2010 census, the population was 9,154.[1] Its county seat is Webster Springs.[2] The county was founded in 1860 and named for Daniel Webster.[3]
Webster County | |
|---|---|
 Webster County Courthouse in Webster Springs, 2007 | |
 Location within the U.S. state of West Virginia | |
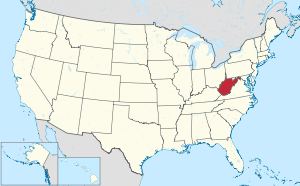 West Virginia's location within the U.S. | |
| Coordinates: 38°29′N 80°26′W | |
| Country | |
| State | |
| Founded | January 10, 1860 |
| Named for | Daniel Webster |
| Seat | Webster Springs |
| Largest town | Webster Springs |
| Area | |
| • Total | 556 sq mi (1,440 km2) |
| • Land | 553 sq mi (1,430 km2) |
| • Water | 2.8 sq mi (7 km2) 0.5%% |
| Population (2010) | |
| • Total | 9,154 |
| • Estimate (2018) | 8,285 |
| • Density | 16/sq mi (6.4/km2) |
| Time zone | UTC−5 (Eastern) |
| • Summer (DST) | UTC−4 (EDT) |
| Congressional district | 3rd |
| Website | www |
History
Webster County was formed from parts of Nicholas, Braxton, and Randolph counties in Virginia through the approval of an act of the Virginia General Assembly during its 1859-1860 session. Movement toward the formation of this county began in 1851.[4][5]
Webster became part of West Virginia on 20 June 1863. When the state was formed, each county was divided into multiple civil townships, with the intention of encouraging local government. This proved impractical in the heavily rural state, so in 1872 the townships were converted into magisterial districts.[6]
Webster County's three original townships, subsequently magisterial districts, were Fork Lick, Glade, and Holly. A fourth district, Hacker Valley,[lower-roman 1] was formed from part of Holly District in 1876. The four historic magisterial districts remained largely unchanged until the 1990s, when they were consolidated into three new districts: Central, Northern, and Southern.[7]
Geography
According to the U.S. Census Bureau, the county has a total area of 556 square miles (1,440 km2), of which 553 square miles (1,430 km2) is land and 2.8 square miles (7.3 km2) (0.5%) is water.[8]
Major highways
Adjacent counties
- Lewis County (north)
- Upshur County (north)
- Randolph County (east)
- Pocahontas County (southeast)
- Greenbrier County (south)
- Nicholas County (southwest)
- Braxton County (west)
National protected area
- Monongahela National Forest (part)
Demographics
| Historical population | |||
|---|---|---|---|
| Census | Pop. | %± | |
| 1860 | 1,555 | — | |
| 1870 | 1,730 | 11.3% | |
| 1880 | 3,207 | 85.4% | |
| 1890 | 4,783 | 49.1% | |
| 1900 | 8,862 | 85.3% | |
| 1910 | 9,680 | 9.2% | |
| 1920 | 11,562 | 19.4% | |
| 1930 | 14,216 | 23.0% | |
| 1940 | 18,080 | 27.2% | |
| 1950 | 17,888 | −1.1% | |
| 1960 | 13,719 | −23.3% | |
| 1970 | 9,809 | −28.5% | |
| 1980 | 12,245 | 24.8% | |
| 1990 | 10,729 | −12.4% | |
| 2000 | 9,719 | −9.4% | |
| 2010 | 9,154 | −5.8% | |
| Est. 2018 | 8,285 | [9] | −9.5% |
| U.S. Decennial Census[10] 1790–1960[11] 1900–1990[12] 1990–2000[13] 2010–2018[1] | |||
2000 census
As of the census[14] of 2000, there were 9,719 people, 4,010 households, and 2,815 families living in the county. The population density was 18 people per square mile (7/km²). There were 5,273 housing units at an average density of 10 per square mile (4/km²). The racial makeup of the county was 99.18% White, 0.01% Black or African American, 0.07% Native American, 0.06% Asian, 0.01% Pacific Islander, 0.01% from other races, and 0.66% from two or more races. 0.37% of the population were Hispanic or Latino of any race.
There were 4,010 households out of which 29.80% had children under the age of 18 living with them, 55.40% were married couples living together, 10.60% had a female householder with no husband present, and 29.80% were non-families. 26.50% of all households were made up of individuals and 12.40% had someone living alone who was 65 years of age or older. The average household size was 2.41 and the average family size was 2.89.
In the county, the population was spread out with 23.00% under the age of 18, 8.00% from 18 to 24, 26.70% from 25 to 44, 27.10% from 45 to 64, and 15.20% who were 65 years of age or older. The median age was 40 years. For every 100 females there were 96.90 males. For every 100 females age 18 and over, there were 94.30 males.
The median income for a household in the county was $21,055, and the median income for a family was $25,049. Males had a median income of $25,362 versus $15,381 for females. The per capita income for the county was $12,284. About 26.60% of families and 31.80% of the population were below the poverty line, including 45.40% of those under age 18 and 21.00% of those age 65 or over.
2010 census
As of the 2010 United States Census, there were 9,154 people, 3,792 households, and 2,595 families living in the county.[15] The population density was 16.5 inhabitants per square mile (6.4/km2). There were 5,428 housing units at an average density of 9.8 per square mile (3.8/km2).[16] The racial makeup of the county was 98.6% white, 0.2% black or African American, 0.1% Asian, 0.1% American Indian, 0.1% from other races, and 1.0% from two or more races. Those of Hispanic or Latino origin made up 0.5% of the population.[15] In terms of ancestry, 19.8% were American, 15.7% were Irish, 12.6% were German, and 8.9% were English.[17]
Of the 3,792 households, 30.1% had children under the age of 18 living with them, 51.8% were married couples living together, 11.2% had a female householder with no husband present, 31.6% were non-families, and 26.5% of all households were made up of individuals. The average household size was 2.40 and the average family size was 2.88. The median age was 44.1 years.[15]
The median income for a household in the county was $28,025 and the median income for a family was $35,448. Males had a median income of $44,277 versus $19,292 for females. The per capita income for the county was $17,268. About 19.9% of families and 22.9% of the population were below the poverty line, including 26.4% of those under age 18 and 12.1% of those age 65 or over.[18]
Politics
Since 1864, Webster County has voted Democratic in every presidential election with the exceptions of 1972, 2012, and 2016. In 1972, Richard Nixon carried the county by a mere 1.08% against George McGovern. However, in 2012 Mitt Romney carried the county handily with a 27.52% margin and in 2016 Donald Trump won by a margin of 57.90%.[19]
| Year | Republican | Democratic | Third parties |
|---|---|---|---|
| 2016 | 76.5% 2,302 | 18.5% 556 | 5.1% 153 |
| 2012 | 61.7% 1,710 | 34.2% 947 | 4.2% 116 |
| 2008 | 45.3% 1,386 | 50.8% 1,552 | 3.9% 119 |
| 2004 | 46.4% 1,724 | 52.9% 1,965 | 0.7% 25 |
| 2000 | 44.9% 1,484 | 53.3% 1,764 | 1.8% 60 |
| 1996 | 19.6% 654 | 68.8% 2,292 | 11.6% 385 |
| 1992 | 22.7% 811 | 64.9% 2,320 | 12.4% 445 |
| 1988 | 31.6% 1,016 | 67.9% 2,185 | 0.5% 16 |
| 1984 | 39.9% 1,565 | 60.0% 2,355 | 0.2% 6 |
| 1980 | 31.8% 1,262 | 64.9% 2,578 | 3.4% 134 |
| 1976 | 24.9% 971 | 75.1% 2,931 | |
| 1972 | 50.5% 2,114 | 49.5% 2,069 | |
| 1968 | 30.2% 1,241 | 62.9% 2,582 | 6.9% 284 |
| 1964 | 20.0% 936 | 80.1% 3,755 | |
| 1960 | 32.7% 1,689 | 67.3% 3,479 | |
| 1956 | 44.4% 2,457 | 55.6% 3,072 | |
| 1952 | 37.2% 2,229 | 62.8% 3,767 | |
| 1948 | 29.0% 1,527 | 70.7% 3,726 | 0.3% 14 |
| 1944 | 32.7% 1,595 | 67.3% 3,285 | |
| 1940 | 31.1% 2,067 | 68.9% 4,579 | |
| 1936 | 30.0% 1,987 | 69.7% 4,613 | 0.3% 18 |
| 1932 | 32.5% 1,781 | 66.9% 3,664 | 0.6% 30 |
| 1928 | 45.5% 1,936 | 54.2% 2,306 | 0.2% 10 |
| 1924 | 38.7% 1,617 | 60.4% 2,523 | 1.0% 40 |
| 1920 | 44.5% 1,562 | 55.3% 1,942 | 0.1% 5 |
| 1916 | 35.9% 854 | 63.5% 1,513 | 0.6% 14 |
| 1912 | 14.1% 307 | 60.9% 1,330 | 25.0% 547 |
Communities
Towns
- Camden-on-Gauley
- Cowen
- Webster Springs (county seat; legally Town of Addison)
Magisterial districts
Current
- Central
- Northern
- Southern
Historic
- Fork Lick
- Glade
- Hacker Valley
- Holly
Unincorporated communities
Notable residents
- Josh Stewart, actor
See also
- Big Ditch Wildlife Management Area
- Holly River State Park
- National Register of Historic Places listings in Webster County, West Virginia
- Mountain Parkway Byway and Backway
Footnotes
- Originally "Hacker's Valley".
References
- "State & County QuickFacts". United States Census Bureau. Retrieved January 16, 2014.
- "Find a County". National Association of Counties. Retrieved June 7, 2011.
- "Archived copy". Archived from the original on 2013-05-29. Retrieved 2013-01-29.CS1 maint: archived copy as title (link)
- County Reports and Maps: Webster County and Portion of Mingo District, 1920, West Virginia Geological and Economic Survey, page 8, Google Books
- [Formation and Organization of Webster County, Ancestry.com Message Boards]
- Otis K. Rice & Stephen W. Brown, West Virginia: A History, 2nd ed., University Press of Kentucky, Lexington (1993), p. 240.
- United States Census Bureau, U.S. Decennial Census, Tables of Minor Civil Divisions in West Virginia, 1870–2010.
- "2010 Census Gazetteer Files". United States Census Bureau. August 22, 2012. Retrieved July 31, 2015.
- "Population and Housing Unit Estimates". Retrieved June 10, 2019.
- "U.S. Decennial Census". United States Census Bureau. Retrieved January 16, 2014.
- "Historical Census Browser". University of Virginia Library. Retrieved January 16, 2014.
- "Population of Counties by Decennial Census: 1900 to 1990". United States Census Bureau. Retrieved January 16, 2014.
- "Census 2000 PHC-T-4. Ranking Tables for Counties: 1990 and 2000" (PDF). United States Census Bureau. Retrieved January 16, 2014.
- "U.S. Census website". United States Census Bureau. Retrieved May 14, 2011.
- "DP-1 Profile of General Population and Housing Characteristics: 2010 Demographic Profile Data". United States Census Bureau. Archived from the original on 2020-02-13. Retrieved 2016-04-03.
- "Population, Housing Units, Area, and Density: 2010 - County". United States Census Bureau. Archived from the original on 2020-02-13. Retrieved 2016-04-03.
- "DP02 SELECTED SOCIAL CHARACTERISTICS IN THE UNITED STATES – 2006-2010 American Community Survey 5-Year Estimates". United States Census Bureau. Archived from the original on 2020-02-13. Retrieved 2016-04-03.
- "DP03 SELECTED ECONOMIC CHARACTERISTICS – 2006-2010 American Community Survey 5-Year Estimates". United States Census Bureau. Archived from the original on 2020-02-13. Retrieved 2016-04-03.
- CNN 2012 Election site
- Leip, David. "Dave Leip's Atlas of U.S. Presidential Elections". uselectionatlas.org. Retrieved 2018-03-28.
Further reading
- Dodrill, William Christian (1915). Moccasin tracks and other imprints. Charleston, WV: Lovett Printing Co. Retrieved 2014-04-20. (Historical sketches of Webster County)
External links
| Wikimedia Commons has media related to Webster County, West Virginia. |
- Official website
- Official website of the Webster County Woodchopping Festival
- Two-Lane Livin' Magazine
Places adjacent to Webster County, West Virginia | ||||||||||
|---|---|---|---|---|---|---|---|---|---|---|
| ||||||||||
Municipalities and communities of Webster County, West Virginia, United States | ||
|---|---|---|
| Towns | Map of West Virginia highlighting Webster County | |
| CDPs | ||
| Unincorporated communities |
| |
| Ghost towns | ||
| Authority control |
|
|---|