Terrebonne (electoral district)
Terrebonne is a federal electoral district in the Canadian province of Quebec. It was represented in the House of Commons of Canada from 1867 to 1997, when it was dissolved in an electoral redistribution. It was reconstituted as an electoral district again beginning with the 2015 election.
.svg.png) Terrebonne in relation to other electoral districts in Montreal and Laval | |||
| Federal electoral district | |||
| Legislature | House of Commons | ||
| MP |
Bloc Québécois | ||
| District created | 1867 | ||
| First contested | 1867 | ||
| Last contested | 2015 | ||
| District webpage | profile, map | ||
| Demographics | |||
| Population (2011)[1] | 106,322 | ||
| Electors (2015) | 83,775 | ||
| Area (km²)[1] | 159 | ||
| Pop. density (per km²) | 668.7 | ||
| Census divisions | Les Moulins | ||
| Census subdivisions | Terrebonne | ||
History
The riding was originally created by the British North America Act of 1867 which preserved existing electoral districts in Lower Canada. It was abolished in 1996 into Repentigny and Terrebonne—Blainville.
It was recreated during the 2012 federal electoral redistribution from parts of Terrebonne—Blainville (51%) and Montcalm (49%), and consists solely of the city of Terrebonne.
Demographics
- According to the Canada 2016 Census
- Languages: (2016) 89.6% French, 2.2% English, 1.9% Creole, 1.7% Spanish, 1.3% Italian, 1.1% Arabic, 0.4% Portuguese, 0.3% Romanian[2]
Members of Parliament
Election results
Terrebonne, 2015–present
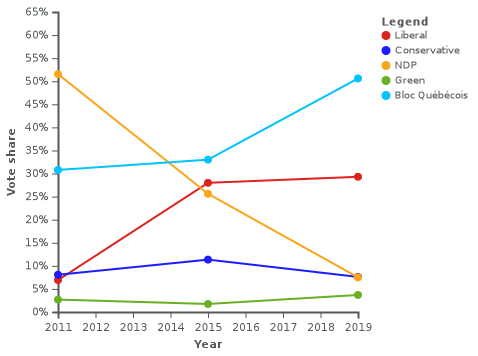
| 2019 Canadian federal election | ||||||||
|---|---|---|---|---|---|---|---|---|
| Party | Candidate | Votes | % | ±% | Expenditures | |||
| Bloc Québécois | Michel Boudrias | 31,029 | 50.6 | |||||
| Liberal | Frédéric Beauchemin | 17,944 | 29.3 | |||||
| Conservative | France Gagnon | 4,640 | 7.6 | |||||
| New Democratic | Maxime Beaudoin | 4,627 | 7.5 | |||||
| Green | Réjean Monette | 2,277 | 3.7 | |||||
| People's | Jeffrey Barnes | 399 | 0.7 | |||||
| Rhinoceros | Paul Vézina | 260 | 0.4 | |||||
| Independent | Jade Hébert | 159 | 0.3 | |||||
| Total valid votes/Expense limit | 61,335 | 100.0 | ||||||
| Total rejected ballots | 1,282 | |||||||
| Turnout | 62,617 | 70.5 | ||||||
| Eligible voters | 88,785 | |||||||
| Source: Elections Canada[3][4] | ||||||||
| 2015 Canadian federal election | ||||||||
|---|---|---|---|---|---|---|---|---|
| Party | Candidate | Votes | % | ±% | Expenditures | |||
| Bloc Québécois | Michel Boudrias | 19,238 | 33.01 | +2.23 | $17,316.45 | |||
| Liberal | Michèle Audette | 16,316 | 27.99 | +21.07 | $28,471.60 | |||
| New Democratic | Charmaine Borg | 14,928 | 25.61 | -25.93 | $66,226.31 | |||
| Conservative | Michel Surprenant | 6,615 | 11.35 | +3.28 | $4,734.68 | |||
| Green | Susan Moen | 1,016 | 1.74 | -0.95 | – | |||
| Strength in Democracy | Louis Clément Sénat | 171 | 0.29 | – | $1,208.41 | |||
| Total valid votes/Expense limit | 58,284 | 100.00 | $222,232.39 | |||||
| Total rejected ballots | 1,256 | 2.11 | – | |||||
| Turnout | 59,540 | 70.63 | – | |||||
| Eligible voters | 84,298 | |||||||
| Bloc Québécois gain from New Democratic | Swing | +14.08 | ||||||
| Source: Elections Canada[5][6] | ||||||||
| 2011 federal election redistributed results[7] | |||
|---|---|---|---|
| Party | Vote | % | |
| New Democratic | 25,625 | 51.54 | |
| Bloc Québécois | 15,304 | 30.78 | |
| Conservative | 4,011 | 8.07 | |
| Liberal | 3,440 | 6.92 | |
| Green | 1,339 | 2.69 | |
Terrebonne, 1867–1997

| 1993 Canadian federal election | ||||||||
|---|---|---|---|---|---|---|---|---|
| Party | Candidate | Votes | % | ±% | ||||
| Bloc Québécois | Benoît Sauvageau | 56,235 | 68.9 | |||||
| Liberal | Claire Brouillet | 14,623 | 17.9 | -0.6 | ||||
| Progressive Conservative | Jean-Marc Robitaille | 9,496 | 11.6 | -41.1 | ||||
| New Democratic | Renée-Claude Lorimier | 873 | 1.1 | -9.7 | ||||
| Commonwealth of Canada | Christian Chouery | 445 | 0.5 | |||||
| Total valid votes | 81,672 | 100.0 | ||||||
| 1988 Canadian federal election | ||||||||
|---|---|---|---|---|---|---|---|---|
| Party | Candidate | Votes | % | ±% | ||||
| Progressive Conservative | Jean-Marc Robitaille | 35,345 | 52.8 | -7.5 | ||||
| Liberal | Claire Brouillet | 12,422 | 18.5 | -7.7 | ||||
| Independent | Robert Toupin | 10,390 | 15.5 | |||||
| New Democratic | Lauraine Vaillancourt | 7,194 | 10.7 | +1.9 | ||||
| Rhinoceros | Alain Cowboy De Lagrave | 1,647 | 2.5 | |||||
| Total valid votes | 66,998 | 100.0 | ||||||
| 1984 Canadian federal election | ||||||||
|---|---|---|---|---|---|---|---|---|
| Party | Candidate | Votes | % | ±% | ||||
| Progressive Conservative | Robert Toupin | 43,822 | 60.3 | +51.2 | ||||
| Liberal | Joseph-Roland Comtois | 19,040 | 26.2 | -42.1 | ||||
| New Democratic | Brian Umansky | 6,454 | 8.9 | -4.2 | ||||
| Parti nationaliste | Jean A. Bonin | 3,060 | 4.2 | |||||
| Commonwealth of Canada | Claude Brosseau | 292 | 0.4 | |||||
| Total valid votes | 72,668 | 100.0 | ||||||
| 1980 Canadian federal election | ||||||||
|---|---|---|---|---|---|---|---|---|
| Party | Candidate | Votes | % | ±% | ||||
| Liberal | Joseph-Roland Comtois | 36,089 | 68.3 | +6.0 | ||||
| New Democratic | Gilles Bertrand | 6,917 | 13.1 | +7.5 | ||||
| Progressive Conservative | Jacques Dupuis | 4,807 | +9.1 | -1.4 | ||||
| Social Credit | Georgette Grenier | 2,839 | 5.4 | -12.9 | ||||
| Rhinoceros | Pédro Gervais G.D. Drapeau | 1,844 | 3.5 | +1.2 | ||||
| Union populaire | Réal Godin | 233 | 0.4 | -0.1 | ||||
| Marxist–Leninist | Jacques Coderre | 131 | 0.2 | 0.0 | ||||
| Total valid votes | 52,860 | 100.0 | ||||||
| 1979 Canadian federal election | ||||||||
|---|---|---|---|---|---|---|---|---|
| Party | Candidate | Votes | % | ±% | ||||
| Liberal | Joseph-Roland Comtois | 34,839 | 62.3 | +7.2 | ||||
| Social Credit | Georgette Grenier | 10,239 | 18.3 | +14.0 | ||||
| Progressive Conservative | Louis-Rhéal Tremblay | 5,845 | 10.5 | -23.8 | ||||
| New Democratic | Roland Francis | 3,114 | 5.6 | +2.7 | ||||
| Rhinoceros | Jean-Marie Da Silva | 1,306 | 2.3 | |||||
| Union populaire | Réal Godin | 298 | 0.5 | |||||
| Marxist–Leninist | André Cousineau | 164 | 0.3 | |||||
| Communist | Gaétan Trudel | 122 | 0.2 | |||||
| Total valid votes | 55,927 | 100.0 | ||||||
| Canadian federal by-election, 24 May 1977 | ||||||||
|---|---|---|---|---|---|---|---|---|
| Party | Candidate | Votes | % | ±% | ||||
| On Mr. Comtois' resignation, 25 October 1976 | ||||||||
| Liberal | Joseph-Roland Comtois | 25,006 | 55.1 | -1.1 | ||||
| Progressive Conservative | Roger Delorme | 15,539 | 34.2 | +14.8 | ||||
| Social Credit | Jean Léveillé | 1,949 | 4.3 | -11.7 | ||||
| New Democratic | Pierre Demers | 1,299 | 2.9 | -4.6 | ||||
| Independent | Gilles Mélançon | 1,151 | 2.5 | |||||
| Communist | Claude Demers | 290 | 0.6 | +0.1 | ||||
| Independent | J. Noël St-Michel | 167 | 0.4 | |||||
| Total valid votes | 45,401 | 100.0 | ||||||
| 1974 Canadian federal election | ||||||||
|---|---|---|---|---|---|---|---|---|
| Party | Candidate | Votes | % | ±% | ||||
| Liberal | Joseph-Roland Comtois | 28,652 | 56.1 | +9.1 | ||||
| Progressive Conservative | Gilles Mélançon | 9,897 | 19.4 | -5.4 | ||||
| Social Credit | Guy Meunier | 8,138 | 15.9 | -4.6 | ||||
| New Democratic | Pierre Demers | 3,812 | 7.5 | -0.1 | ||||
| Marxist–Leninist | Françoise Daoust | 272 | 0.5 | |||||
| Communist | Nicole Ledoux | 265 | 0.5 | |||||
| Total valid votes | 51,036 | 100.0 | ||||||
| 1972 Canadian federal election | ||||||||
|---|---|---|---|---|---|---|---|---|
| Party | Candidate | Votes | % | ±% | ||||
| Liberal | Joseph-Roland Comtois | 24,928 | 47.1 | -15.0 | ||||
| Social Credit | Guy Meunier | 13,136 | 24.8 | +20.8 | ||||
| Progressive Conservative | Michel Coté | 10,885 | 20.5 | +0.3 | ||||
| New Democratic | Pierre Demers | 4,022 | 7.6 | -3.7 | ||||
| Total valid votes | 52,971 | 100.0 | ||||||
Note: Social Credit vote is compared to Ralliement créditiste vote in the 1968 election.
| 1968 Canadian federal election | ||||||||
|---|---|---|---|---|---|---|---|---|
| Party | Candidate | Votes | % | ±% | ||||
| Liberal | Joseph-Roland Comtois | 21,191 | 62.0 | +17.8 | ||||
| Progressive Conservative | Jacques Vachon | 6,934 | 20.3 | -7.1 | ||||
| New Democratic | Jean-Maurice Sénécal | 3,860 | 11.3 | -2.9 | ||||
| Ralliement créditiste | Rosario Therrien | 1,363 | 4.0 | -10.2 | ||||
| Démocratisation Économique | Pierre Therrien | 824 | 2.4 | |||||
| Total valid votes | 34,172 | 100.0 | ||||||
| 1965 Canadian federal election | ||||||||
|---|---|---|---|---|---|---|---|---|
| Party | Candidate | Votes | % | ±% | ||||
| Liberal | Léo Cadieux | 16,806 | 44.2 | -1.8 | ||||
| Progressive Conservative | André Fauteux | 10,417 | 27.4 | +15.8 | ||||
| Ralliement créditiste | Jean-Marc Fontaine | 5,412 | 14.2 | -18.7 | ||||
| New Democratic | Jean-Maurice Sénécal | 5,384 | 14.2 | +4.7 | ||||
| Total valid votes | 38,019 | 100.0 | ||||||
Note: Ralliement créditiste vote is compared to Social Credit vote in the 1963 election.
| 1963 Canadian federal election | ||||||||
|---|---|---|---|---|---|---|---|---|
| Party | Candidate | Votes | % | ±% | ||||
| Liberal | Léo Cadieux | 19,015 | 46.0 | +6.8 | ||||
| Social Credit | Hubert Murray | 13,618 | 33.0 | +9.6 | ||||
| Progressive Conservative | Bert Walker | 4,798 | 11.6 | -16.5 | ||||
| New Democratic | Gérard Gagnon | 3,895 | 9.4 | +0.1 | ||||
| Total valid votes | 41,326 | 100.0 | ||||||
| 1962 Canadian federal election | ||||||||
|---|---|---|---|---|---|---|---|---|
| Party | Candidate | Votes | % | ±% | ||||
| Liberal | Léo Cadieux | 15,547 | 39.2 | -9.4 | ||||
| Progressive Conservative | Marcel Deschambault | 11,155 | 28.1 | -23.3 | ||||
| Social Credit | Lucien Bachand | 9,269 | 23.4 | |||||
| New Democratic | Jean Philip | 3,680 | 9.3 | |||||
| Total valid votes | 39,651 | 100.0 | ||||||
| 1958 Canadian federal election | ||||||||
|---|---|---|---|---|---|---|---|---|
| Party | Candidate | Votes | % | ±% | ||||
| Progressive Conservative | Marcel Deschambault | 19,319 | 51.4 | +11.5 | ||||
| Liberal | Raymond Raymond | 18,241 | 48.6 | -11.5 | ||||
| Total valid votes | 37,560 | 100.0 | ||||||
| 1957 Canadian federal election | ||||||||
|---|---|---|---|---|---|---|---|---|
| Party | Candidate | Votes | % | |||||
| Liberal | Raymond Raymond | 19,515 | 60.1 | |||||
| Progressive Conservative | Marcel Deschambault | 12,973 | 39.9 | |||||
| Total valid votes | 32,488 | 100.0 | ||||||
| 1953 Canadian federal election | ||||||||
|---|---|---|---|---|---|---|---|---|
| Party | Candidate | Votes | ||||||
| Liberal | Lionel Bertrand | acclaimed | ||||||
| 1949 Canadian federal election | ||||||||
|---|---|---|---|---|---|---|---|---|
| Party | Candidate | Votes | % | ±% | ||||
| Liberal | Lionel Bertrand | 18,304 | 66.9 | +0.2 | ||||
| Progressive Conservative | Lucien Thinel | 8,107 | 29.6 | |||||
| Union des électeurs | Jean-Paul Houle | 953 | 3.5 | |||||
| Total valid votes | 27,364 | 100.0 | ||||||
| 1945 Canadian federal election | ||||||||
|---|---|---|---|---|---|---|---|---|
| Party | Candidate | Votes | % | ±% | ||||
| Liberal | Lionel Bertrand | 15,383 | 66.6 | +26.9 | ||||
| Bloc populaire | Henri Dionne | 6,726 | 29.1 | |||||
| Independent | Charles Aubry | 691 | 3.0 | |||||
| Co-operative Commonwealth | Louis-Philippe Lebel | 281 | 1.2 | |||||
| Total valid votes | 23,081 | 100.0 | ||||||
| 1940 Canadian federal election | ||||||||
|---|---|---|---|---|---|---|---|---|
| Party | Candidate | Votes | % | ±% | ||||
| Independent Liberal | Lionel Bertrand | 7,839 | 44.9 | |||||
| Liberal | Louis-Étienne Parent | 6,938 | 39.8 | -25.3 | ||||
| National Government | Léopold Lachapelle | 2,668 | 15.3 | -11.9 | ||||
| Total valid votes | 17,445 | 100.0 | ||||||
Note: "National Government" vote is compared to Conservative vote in 1935 election.
| 1935 Canadian federal election | ||||||||
|---|---|---|---|---|---|---|---|---|
| Party | Candidate | Votes | % | ±% | ||||
| Liberal | Louis-Étienne Parent | 9,900 | 65.1 | +8.9 | ||||
| Conservative | Léopold Nantel | 4,141 | 27.2 | -16.6 | ||||
| Liberal | Eugène Léveillé | 1,172 | 7.7 | |||||
| Total valid votes | 15,213 | 100.0 | ||||||
| 1930 Canadian federal election | ||||||||
|---|---|---|---|---|---|---|---|---|
| Party | Candidate | Votes | % | ±% | ||||
| Liberal | Louis-Étienne Parent | 8,609 | 56.1 | -19.5 | ||||
| Conservative | Guillaume-André Fauteux | 6,727 | 43.9 | +19.5 | ||||
| Total valid votes | 15,336 | 100.0 | ||||||
| 1926 Canadian federal election | ||||||||
|---|---|---|---|---|---|---|---|---|
| Party | Candidate | Votes | % | ±% | ||||
| Liberal | Jules-Édouard Prévost | 7,060 | 75.7 | +3.4 | ||||
| Conservative | Léopold Nantel | 2,270 | 24.3 | -3.4 | ||||
| Total valid votes | 9,330 | 100.0 | ||||||
| 1925 Canadian federal election | ||||||||
|---|---|---|---|---|---|---|---|---|
| Party | Candidate | Votes | % | ±% | ||||
| Liberal | Jules-Édouard Prévost | 6,789 | 72.2 | +1.3 | ||||
| Conservative | Léopold Nantel | 2,609 | 27.8 | -1.3 | ||||
| Total valid votes | 9,398 | 100.0 | ||||||
| 1921 Canadian federal election | ||||||||
|---|---|---|---|---|---|---|---|---|
| Party | Candidate | Votes | % | |||||
| Liberal | Jules-Édouard Prévost | 8,882 | 71.0 | |||||
| Conservative | Guillaume-André Fauteux | 3,636 | 29.0 | |||||
| Total valid votes | 12,518 | 100.0 | ||||||
| 1917 Canadian federal election | ||||||||
|---|---|---|---|---|---|---|---|---|
| Party | Candidate | Votes | ||||||
| Opposition (Laurier Liberals) | Jules-Édouard Prévost | acclaimed | ||||||
| Canadian federal by-election, 8 February 1915 | ||||||||
|---|---|---|---|---|---|---|---|---|
| Party | Candidate | Votes | % | |||||
| Conservative | Gédéon Rochon | 2,193 | 53.6 | |||||
| Unknown | Joseph-Alphonse Beaulieu | 1,895 | 46.4 | |||||
| Total valid votes | 4,088 | 100.0 | ||||||
| Called upon Mr. Nantel being appointed Railway Commissioner, 20 October 1914. | ||||||||
| By-election on 27 October 1911
On Mr. Nantel being appointed Minister of Inland Revenue, 10 October 1911 | |||||
| Party | Candidate | Votes | |||
|---|---|---|---|---|---|
| Conservative | Wilfrid-Bruno Nantel | acclaimed | |||
| 1911 Canadian federal election | ||||||||
|---|---|---|---|---|---|---|---|---|
| Party | Candidate | Votes | % | ±% | ||||
| Conservative | Wilfrid-Bruno Nantel | 2,727 | 56.5 | +5.7 | ||||
| Liberal | Samuel Desjardins | 2,101 | 43.5 | -5.7 | ||||
| Total valid votes | 4,828 | 100.0 | ||||||
| 1908 Canadian federal election | ||||||||
|---|---|---|---|---|---|---|---|---|
| Party | Candidate | Votes | % | ±% | ||||
| Conservative | Wilfrid-Bruno Nantel | 2,592 | 50.8 | +2.7 | ||||
| Liberal | Thibaudeau Rinfret | 2,513 | 49.2 | -2.7 | ||||
| Total valid votes | 5,105 | 100.0 | ||||||
| 1904 Canadian federal election | ||||||||
|---|---|---|---|---|---|---|---|---|
| Party | Candidate | Votes | % | ±% | ||||
| Liberal | Samuel Desjardins | 2,481 | 51.9 | -1.5 | ||||
| Conservative | W. Bruno Nantel | 2,297 | 48.1 | +1.5 | ||||
| Total valid votes | 4,778 | 100.0 | ||||||
| Canadian federal by-election, 24 February 1903 | ||||||||
|---|---|---|---|---|---|---|---|---|
| Party | Candidate | Votes | % | ±% | ||||
| Préfontaine was appointed Minister of Marine and Fisheries, 11 November 1902 | ||||||||
| Liberal | Samuel Desjardins | 2,325 | 53.4 | +0.3 | ||||
| Conservative | A.H. Masson | 2,029 | 46.6 | -0.3 | ||||
| Total valid votes | 4,354 | 100.0 | ||||||
| 1900 Canadian federal election | ||||||||
|---|---|---|---|---|---|---|---|---|
| Party | Candidate | Votes | % | ±% | ||||
| Liberal | Raymond Préfontaine | 2,277 | 53.1 | +4.9 | ||||
| Conservative | Léon-Adolphe Chauvin | 2,010 | 46.9 | -4.9 | ||||
| Total valid votes | 4,287 | 100.0 | ||||||
| 1896 Canadian federal election | ||||||||
|---|---|---|---|---|---|---|---|---|
| Party | Candidate | Votes | % | ±% | ||||
| Conservative | Léon-Adolphe Chauvin | 1,862 | 51.8 | -10.1 | ||||
| Liberal | P.F.C. Petit | 1,734 | 48.2 | +10.1 | ||||
| Total valid votes | 3,596 | 100.0 | ||||||
Note: popular vote is compared to vote in 1891 general election.
| By-election on 10 January 1893
Chapleau was appointed Lieutenant-Governor | |||||
| Party | Candidate | Votes | |||
|---|---|---|---|---|---|
| Conservative | Pierre Leclaire | acclaimed | |||
| 1891 Canadian federal election | ||||||||
|---|---|---|---|---|---|---|---|---|
| Party | Candidate | Votes | % | ±% | ||||
| Conservative | J.A. Chapleau | 1,830 | 61.9 | -1.8 | ||||
| Liberal | M.D. Limoges | 1,126 | 38.1 | +1.8 | ||||
| Total valid votes | 2,956 | 100.0 | ||||||
| 1887 Canadian federal election | ||||||||
|---|---|---|---|---|---|---|---|---|
| Party | Candidate | Votes | % | ±% | ||||
| Conservative | J.A. Chapleau | 1,819 | 63.8 | -1.8 | ||||
| Liberal | M.J. Therrien | 1,034 | 36.2 | |||||
| Total valid votes | 2,853 | 100.0 | ||||||
| By-election on 16 August 1882
To allow Mr. Chapleau to run for office. | |||||
| Party | Candidate | Votes | |||
|---|---|---|---|---|---|
| Conservative | J.A. Chapleau | acclaimed | |||
Note: popular vote is compared to vote in 1882 general election.
| 1882 Canadian federal election | ||||||||
|---|---|---|---|---|---|---|---|---|
| Party | Candidate | Votes | % | ±% | ||||
| Conservative | G.A. Nantel | 1,593 | 65.6 | -21.3 | ||||
| Unknown | A.E. Poirier | 836 | 34.4 | |||||
| Total valid votes | 2,429 | 100.0 | ||||||
Note: popular vote is compared to vote in 1878 general election.
| By-election on 6 November 1878
Masson was appointed Minister of | |||||
| Party | Candidate | Votes | |||
|---|---|---|---|---|---|
| Conservative | Louis-Rodrigue Masson | acclaimed | |||
| 1878 Canadian federal election | ||||||||
|---|---|---|---|---|---|---|---|---|
| Party | Candidate | Votes | % | |||||
| Conservative | Louis-Rodrigue Masson | 1,194 | 86.8 | |||||
| Unknown | B. Longpré A | 181 | 13.2 | |||||
| Total valid votes | 1,375 | 100.0 | ||||||
| 1874 Canadian federal election | ||||||||
|---|---|---|---|---|---|---|---|---|
| Party | Candidate | Votes | ||||||
| Conservative | Louis-Rodrigue Masson | acclaimed | ||||||
| 1872 Canadian federal election | ||||||||
|---|---|---|---|---|---|---|---|---|
| Party | Candidate | Votes | ||||||
| Conservative | Louis-Rodrigue Masson | acclaimed | ||||||
| 1867 Canadian federal election | ||||||||
|---|---|---|---|---|---|---|---|---|
| Party | Candidate | Votes | ||||||
| Conservative | Louis-Rodrigue Masson | acclaimed | ||||||
References
- Statistics Canada: 2012
- https://www12.statcan.gc.ca/census-recensement/2016/dp-pd/dt-td/Rp-eng.cfm?LANG=E&APATH=3&DETAIL=0&DIM=0&FL=A&FREE=0&GC=0&GID=0&GK=0&GRP=1&PID=109979&PRID=10&PTYPE=109445&S=0&SHOWALL=0&SUB=888&Temporal=2016,2017&THEME=118&VID=0&VNAMEE=&VNAMEF=
- "List of confirmed candidates". Elections Canada. Retrieved October 3, 2019.
- "Election Night Results". Elections Canada. Retrieved November 10, 2019.
- Elections Canada – Confirmed candidates for Terrebonne, 30 September 2015
- Elections Canada – Preliminary Election Expenses Limits for Candidates
- Pundits' Guide To Canadian Elections