Chicoutimi—Le Fjord
Chicoutimi—Le Fjord (formerly known as Chicoutimi) is a federal electoral district in Quebec, Canada, that has been represented in the House of Commons of Canada since 1925. The riding consists of the northern part of the Chicoutimi borough of Saguenay, as well as the La Baie borough and the municipalities of Ferland-et-Boilleau, L'Anse-Saint-Jean, Petit-Saguenay, Rivière-Éternité and Saint-Félix-d'Otis and the unorganized territory of Lalemant.
| Federal electoral district | |||
|---|---|---|---|
| Legislature | House of Commons | ||
| MP |
Conservative | ||
| District created | 1924 | ||
| First contested | 1925 | ||
| Last contested | 2019 | ||
| District webpage | profile, map | ||
| Demographics | |||
| Population (2016)[1] | 81,639 | ||
| Electors (2015) | 66,674 | ||
| Area (km²)[2] | 2,819 | ||
| Pop. density (per km²) | 29 | ||
| Census divisions | Le Fjord-du-Saguenay RCM, Saguenay | ||
| Census subdivisions | Ferland-et-Boilleau, Lalemant, L'Anse-Saint-Jean, Petit-Saguenay, Rivière-Éternité, Saguenay, Saint-Félix-d'Otis | ||
It was created as "Chicoutimi" riding in 1924 from Chicoutimi—Saguenay. It was renamed "Chicoutimi—Le Fjord" in 2000.
The neighbouring ridings are Manicouagan, Beauport—Côte-de-Beaupré—Île d'Orléans—Charlevoix, and Jonquière.
Geography
The riding has always been centred on the city (now borough) of Chicoutimi, Quebec. When it was created, the riding consisted of Chicoutimi County until 1947, when the western half of the riding became the new riding of Lapointe. The 1976 redistribution removed all of the riding's territory north of the Saguenay River. This territory was added back to the riding in the 2003 redistribution. This riding lost some territory to Jonquière during the 2012 electoral redistribution, including much of the area north of the Saguenay River again.
Demographics
- According to the Canada 2016 Census[3]
Ethnic groups: 94.2% White, 4.2% Indigenous
Languages: 98.0% French, 1.2% English
Religions (2011): 93.0% Christian (90.8% Catholic, 2.2% Other Christian), 6.4% None.
Median income: $32,291 (2015)
Average income: $40,803 (2015)
Members of Parliament
This riding has elected the following Members of Parliament:
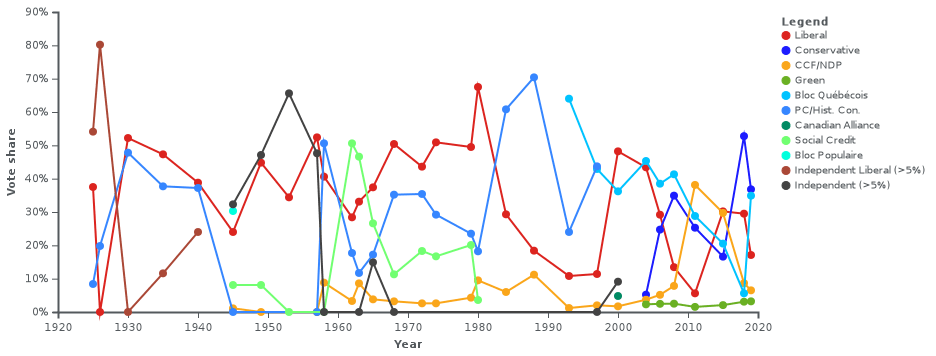
The riding followed the typical path of most nationalist Quebec ridings, except for an independent being elected (1945–1957), and former MP André Harvey narrowly defeating incumbent Gilbert Fillion in 1997, one of only a few PC seats in Quebec that year.
Election results
| 2019 Canadian federal election | ||||||||
|---|---|---|---|---|---|---|---|---|
| Party | Candidate | Votes | % | ±% | Expenditures | |||
| Conservative | Richard Martel | 16,155 | 36.8 | -15.87 | ||||
| Bloc Québécois | Valérie Tremblay | 15,321 | 34.9 | +29.30 | ||||
| Liberal | Dajana Dautovic | 7,504 | 17.1 | -12.40 | ||||
| New Democratic | Stéphane Girard | 2,855 | 6.5 | -2.15 | ||||
| Green | Lynda Youde | 1,388 | 3.2 | +0.11 | ||||
| People's | Jimmy Voyer | 359 | 0.8 | – | ||||
| Rhinoceros | Line Bélanger | 299 | 0.7 | – | ||||
| Total valid votes/Expense limit | 43,881 | 100.0 | ||||||
| Total rejected ballots | 925 | 2.14 | +0.47 | |||||
| Turnout | 44,806 | 68.28 | +1.61 | |||||
| Eligible voters | 65,618 | |||||||
| Source: Elections Canada[4][5] | ||||||||
| Canadian federal by-election, June 18, 2018 Resignation of Denis Lemieux | ||||||||
|---|---|---|---|---|---|---|---|---|
| Party | Candidate | Votes | % | ±% | ||||
| Conservative | Richard Martel | 12,600 | 52.76 | +36.16 | ||||
| Liberal | Lina Boivin | 7,044 | 29.50 | -1.60 | ||||
| New Democratic | Éric Dubois | 2,065 | 8.65 | -21.07 | ||||
| Bloc Québécois | Catherine Bouchard-Tremblay | 1,337 | 5.60 | -14.92 | ||||
| Green | Lynda Youde | 738 | 3.09 | +1.02 | ||||
| Independent | John Turmel | 98 | 0.41 | |||||
| Total valid votes/Expense limit | 23,882 | 98.67 | ||||||
| Total rejected ballots | 322 | 1.33 | -0.34 | |||||
| Turnout | 24,294 | 36.52 | -30.15 | |||||
| Eligible voters | 66,267 | |||||||
| Conservative gain from Liberal | Swing | +18.88 | ||||||
| Source:Elections Canada: Official Voting Results | ||||||||
| 2015 Canadian federal election | ||||||||
|---|---|---|---|---|---|---|---|---|
| Party | Candidate | Votes | % | ±% | Expenditures | |||
| Liberal | Denis Lemieux | 13,619 | 31.09 | +25.34 | $15,757.95 | |||
| New Democratic | Dany Morin | 13,019 | 29.72 | -7.96 | $61,908.19 | |||
| Bloc Québécois | Élise Gauthier | 8,990 | 20.52 | -8.29 | $34,879.59 | |||
| Conservative | Caroline Ste-Marie | 7,270 | 16.60 | -8.97 | $33,846.47 | |||
| Green | Dany St-Gelais | 907 | 2.07 | +0.55 | $64.43 | |||
| Total valid votes/Expense limit | 43,805 | 98.33 | $201,130.77 | |||||
| Total rejected ballots | 745 | 1.67 | – | |||||
| Turnout | 44,550 | 66.67 | – | |||||
| Eligible voters | 66,821 | |||||||
| Liberal gain from New Democratic | Swing | +16.65 | ||||||
| Source: Elections Canada[6][7] | ||||||||
| 2011 federal election redistributed results[8] | |||
|---|---|---|---|
| Party | Vote | % | |
| New Democratic | 16,238 | 37.68 | |
| Bloc Québécois | 12,418 | 28.81 | |
| Conservative | 11,017 | 25.56 | |
| Liberal | 2,479 | 5.75 | |
| Green | 655 | 1.52 | |
| Others | 289 | 0.67 | |
| 2011 Canadian federal election | ||||||||
|---|---|---|---|---|---|---|---|---|
| Party | Candidate | Votes | % | ±% | Expenditures | |||
| New Democratic | Dany Morin | 19,430 | 38.13 | +30.30 | ||||
| Bloc Québécois | Robert Bouchard | 14,675 | 28.80 | -12.51 | ||||
| Conservative | Carol Néron | 12,881 | 25.28 | -9.63 | ||||
| Liberal | Marc Pettersen | 2,852 | 5.60 | -7.85 | ||||
| Green | Charles-Olivier Bolduc-Tremblay | 780 | 1.53 | -0.97 | ||||
| Rhinoceros | Marielle Couture | 340 | 0.67 | – | ||||
| Total valid votes/Expense limit | 50,958 | 98.69 | ||||||
| Total rejected ballots | 678 | 1.31 | -0.24 | |||||
| Turnout | 51,636 | 65.06 | +2.82 | |||||
| Eligible voters | 79,369 | – | ||||||
| New Democratic gain from Bloc Québécois | Swing | +21.40 | ||||||
| 2008 Canadian federal election | ||||||||
|---|---|---|---|---|---|---|---|---|
| Party | Candidate | Votes | % | ±% | Expenditures | |||
| Bloc Québécois | Robert Bouchard | 19,737 | 41.31 | +2.82 | $87,392 | |||
| Conservative | Jean-Guy Maltais | 16,680 | 34.91 | +10.19 | $73,050 | |||
| Liberal | Marc Pettersen | 6,425 | 13.45 | -15.74 | $11,593 | |||
| New Democratic | Stéphane Girard | 3,742 | 7.83 | +2.69 | $2,101 | |||
| Green | Jean-François Veilleux | 1,193 | 2.50 | +0.04 | ||||
| Total valid votes/Expense limit | 47,777 | 98.44 | $100,545 | |||||
| Total rejected ballots | 756 | 1.56 | +0.42 | |||||
| Turnout | 48,533 | 62.25 | -2.47 | |||||
| Eligible voters | 77,959 | – | ||||||
| Bloc Québécois hold | Swing | -3.68 | ||||||
| 2006 Canadian federal election | ||||||||
|---|---|---|---|---|---|---|---|---|
| Party | Candidate | Votes | % | ±% | Expenditures | |||
| Bloc Québécois | Robert Bouchard | 19,226 | 38.49 | -6.8 | $72,889 | |||
| Liberal | André Harvey | 14,581 | 29.19 | -14.2 | $52,235 | |||
| Conservative | Alcide Boudreault | 12,350 | 24.72 | +19.4 | $7,792 | |||
| New Democratic | Éric Dubois | 2,571 | 5.15 | +1.4 | $4,812 | |||
| Green | Jean-Martin Gauthier | 1,226 | 2.45 | +0.2 | ||||
| Total valid votes/Expense limit | 49,954 | 98.86 | $94,498 | |||||
| Total rejected ballots | 575 | 1.14 | ||||||
| Turnout | 50,529 | 64.72 | -2.11 | |||||
| Eligible voters | 78,073 | – | ||||||
| 2004 Canadian federal election | ||||||||
|---|---|---|---|---|---|---|---|---|
| Party | Candidate | Votes | % | ±% | Expenditures | |||
| Bloc Québécois | Robert Bouchard | 20,650 | 45.3 | +9.2 | $63,059 | |||
| Liberal | André Harvey | 19,787 | 43.4 | -4.8 | $69,076 | |||
| Conservative | Alcide Boudreault | 2,385 | 5.2 | +0.4 | $17,677 | |||
| New Democratic | Éric Dubois | 1,699 | 3.7 | +2.1 | $7,418 | |||
| Green | Paul Tremblay | 1,038 | 2.3 | > | ||||
| Total valid votes/Expense limit | 45,559 | 100.0 | $93,636 | |||||
Note: Conservative vote is compared to the Canadian Alliance vote in the 2000 election.
| 2000 Canadian federal election | ||||||||
|---|---|---|---|---|---|---|---|---|
| Party | Candidate | Votes | % | ±% | ||||
| Liberal | André Harvey | 20,105 | 48.2 | +36.9 | ||||
| Bloc Québécois | Noel Tremblay | 15,073 | 36.2 | -6.8 | ||||
| Independent | Mauril Desbiens | 3,797 | 9.1 | |||||
| Alliance | Douglas Schroeder-Tabah | 2,001 | 4.8 | |||||
| New Democratic | Alain Ranger | 698 | 1.7 | -0.3 | ||||
| Total valid votes | 41,674 | 100.0 | ||||||
| 1997 Canadian federal election | ||||||||
|---|---|---|---|---|---|---|---|---|
| Party | Candidate | Votes | % | ±% | ||||
| Progressive Conservative | André Harvey | 18,598 | 43.7 | +19.7 | ||||
| Bloc Québécois | Gilbert Fillion | 18,281 | 42.9 | -21.1 | ||||
| Liberal | Eric Delisle | 4,839 | 11.4 | +0.6 | ||||
| New Democratic | Anne-Marie Buck | 853 | 2.0 | +0.8 | ||||
| Total valid votes | 42,571 | 100.0 | ||||||
| 1993 Canadian federal election | ||||||||
|---|---|---|---|---|---|---|---|---|
| Party | Candidate | Votes | % | ±% | ||||
| Bloc Québécois | Gilbert Fillion | 29,392 | 64.0 | |||||
| Progressive Conservative | André Harvey | 11,038 | 24.0 | -46.4 | ||||
| Liberal | Georges Frenette | 4,958 | 10.8 | -7.7 | ||||
| New Democratic | Christine Moore | 541 | 1.2 | -10.0 | ||||
| Total valid votes | 45,929 | 100.0 | ||||||
| 1988 Canadian federal election | ||||||||
|---|---|---|---|---|---|---|---|---|
| Party | Candidate | Votes | % | ±% | ||||
| Progressive Conservative | André Harvey | 30,699 | 70.4 | +9.6 | ||||
| Liberal | Laval Gauthier | 8,047 | 18.4 | -10.8 | ||||
| New Democratic | Mustapha Elayoubi | 4,870 | 11.2 | +5.1 | ||||
| Total valid votes | 43,616 | 100.0 | ||||||
| 1984 Canadian federal election | ||||||||
|---|---|---|---|---|---|---|---|---|
| Party | Candidate | Votes | % | ±% | ||||
| Progressive Conservative | André Harvey | 22,304 | 60.8 | +42.6 | ||||
| Liberal | Marcel Dionne | 10,736 | 29.3 | -38.2 | ||||
| New Democratic | Denise Coté | 2,211 | 6.0 | -3.5 | ||||
| Rhinoceros | Réjean Fou Fournier | 801 | 2.2 | |||||
| Parti nationaliste | Marie-Claude Desloges | 626 | 1.7 | |||||
| Total valid votes | 36,678 | 100.0 | ||||||
| 1980 Canadian federal election | ||||||||
|---|---|---|---|---|---|---|---|---|
| Party | Candidate | Votes | % | ±% | ||||
| Liberal | Marcel Dionne | 20,821 | 67.5 | +18.1 | ||||
| Progressive Conservative | Rodrigue Begin | 5,607 | 18.2 | -5.3 | ||||
| New Democratic | Marc St-Hilaire | 2,926 | 9.5 | +5.2 | ||||
| Social Credit | Hilaire Vézina | 1,110 | 3.6 | -16.5 | ||||
| Union populaire | Carol Lavoie | 375 | 1.2 | |||||
| Total valid votes | 30,839 | 100.0 | ||||||
| 1979 Canadian federal election | ||||||||
|---|---|---|---|---|---|---|---|---|
| Party | Candidate | Votes | % | ±% | ||||
| Liberal | Marcel Dionne | 16,605 | 49.5 | -1.4 | ||||
| Progressive Conservative | Jean-Marc Lavoie | 7,897 | 23.5 | -5.7 | ||||
| Social Credit | Magella Tremblay | 6,763 | 20.1 | +3.4 | ||||
| New Democratic | Marc St-Hilaire | 1,435 | 4.3 | +1.7 | ||||
| Rhinoceros | Eric Blackburn | 872 | 2.6 | |||||
| Total valid votes | 33,572 | 100.0 | ||||||
| 1974 Canadian federal election | ||||||||
|---|---|---|---|---|---|---|---|---|
| Party | Candidate | Votes | % | ±% | ||||
| Liberal | Paul Langlois | 17,096 | 50.9 | +7.2 | ||||
| Progressive Conservative | Jean-Marc Lavoie | 9,817 | 29.2 | -6.2 | ||||
| Social Credit | Maurice Côté | 5,618 | 16.7 | -1.6 | ||||
| New Democratic | Colette Richard | 882 | 2.6 | 0.0 | ||||
| Marxist–Leninist | Robert Laporte | 202 | 0.6 | |||||
| Total valid votes | 33,615 | 100.0 | ||||||
| 1972 Canadian federal election | ||||||||
|---|---|---|---|---|---|---|---|---|
| Party | Candidate | Votes | % | ±% | ||||
| Liberal | Paul Langlois | 15,655 | 43.6 | -6.7 | ||||
| Progressive Conservative | Jean-Marc Lavoie | 12,712 | 35.4 | +0.3 | ||||
| Social Credit | Maurice Côté | 6,572 | 18.3 | +7.0 | ||||
| New Democratic | Serge Morin | 935 | 2.6 | -0.5 | ||||
| Total valid votes | 35,874 | 100.0 | ||||||
Note: Social Credit vote is compared to Ralliement créditiste vote in the 1968 election.
| 1968 Canadian federal election | ||||||||
|---|---|---|---|---|---|---|---|---|
| Party | Candidate | Votes | % | ±% | ||||
| Liberal | Paul Langlois | 14,054 | 50.4 | +12.9 | ||||
| Progressive Conservative | Jean-Marc Lavoie | 9,811 | 35.2 | +18.0 | ||||
| Ralliement créditiste | Antonio Simard | 3,151 | 11.3 | -15.4 | ||||
| New Democratic | Jean-Baptiste Gauthier | 879 | 3.2 | -0.7 | ||||
| Total valid votes | 27,895 | 100.0 | ||||||
| 1965 Canadian federal election | ||||||||
|---|---|---|---|---|---|---|---|---|
| Party | Candidate | Votes | % | ±% | ||||
| Liberal | Paul Langlois | 11,092 | 37.4 | +4.4 | ||||
| Ralliement créditiste | Majella Tremblay | 7,894 | 26.6 | -20.0 | ||||
| Progressive Conservative | Vincent Brassard | 5,087 | 17.2 | +5.4 | ||||
| Independent | Maurice Côté | 4,419 | 14.9 | |||||
| New Democratic | Denis Beaudoin | 1,131 | 3.8 | -4.8 | ||||
| Total valid votes | 29,623 | 100.0 | ||||||
Note: Ralliement créditiste vote is compared to Social Credit vote in the 1963 election.
| 1963 Canadian federal election | ||||||||
|---|---|---|---|---|---|---|---|---|
| Party | Candidate | Votes | % | ±% | ||||
| Social Credit | Maurice Côté | 14,581 | 46.6 | -4.0 | ||||
| Liberal | Gérard Tremblay | 10,334 | 33.1 | |||||
| Progressive Conservative | Claude Bouchard | 3,670 | 11.7 | -6.0 | ||||
| New Democratic | Maurice Villeneuve | 2,687 | 8.6 | +5.3 | ||||
| Total valid votes | 31,272 | 100.0 | ||||||
| 1962 Canadian federal election | ||||||||
|---|---|---|---|---|---|---|---|---|
| Party | Candidate | Votes | % | ±% | ||||
| Social Credit | Maurice Côté | 16,566 | 50.6 | |||||
| Liberal | Gérard Tremblay | 9,310 | 28.4 | -12.2 | ||||
| Progressive Conservative | Vincent Brassard | 5,803 | 17.7 | -32.9 | ||||
| New Democratic | Maurice Villeneuve | 1,071 | 3.3 | -5.5 | ||||
| Total valid votes | 32,750 | 100.0 | ||||||
| 1958 Canadian federal election | ||||||||
|---|---|---|---|---|---|---|---|---|
| Party | Candidate | Votes | % | ±% | ||||
| Progressive Conservative | Vincent Brassard | 15,407 | 50.6 | |||||
| Liberal | Rosaire Gauthier | 12,348 | 40.6 | -11.8 | ||||
| Co-operative Commonwealth | Victor Gladu | 2,666 | 8.8 | |||||
| Total valid votes | 30,421 | 100.0 | ||||||
| 1957 Canadian federal election | ||||||||
|---|---|---|---|---|---|---|---|---|
| Party | Candidate | Votes | % | ±% | ||||
| Liberal | Rosaire Gauthier | 15,124 | 52.4 | +18.0 | ||||
| Independent | Paul-Edmond Gagnon | 13,733 | 47.6 | -18.0 | ||||
| Total valid votes | 28,857 | 100.0 | ||||||
| 1953 Canadian federal election | ||||||||
|---|---|---|---|---|---|---|---|---|
| Party | Candidate | Votes | % | ±% | ||||
| Independent | Paul-Edmond Gagnon | 16,046 | 65.6 | 18.5 | ||||
| Liberal | Roland Angers | 8,408 | 34.4 | -10.5 | ||||
| Total valid votes | 24,454 | 100.0 | ||||||
| 1949 Canadian federal election | ||||||||
|---|---|---|---|---|---|---|---|---|
| Party | Candidate | Votes | % | ±% | ||||
| Independent | Paul-Edmond Gagnon | 10,252 | 47.1 | +14.8 | ||||
| Liberal | Charles-Henri Desbiens | 9,763 | 44.8 | +20.8 | ||||
| Union des électeurs | Charles-David Jean | 1,757 | 8.1 | -0.1 | ||||
| Total valid votes | 21,772 | 100.0 | ||||||
| 1945 Canadian federal election | ||||||||
|---|---|---|---|---|---|---|---|---|
| Party | Candidate | Votes | % | ±% | ||||
| Independent | Paul-Edmond Gagnon | 10,796 | 32.3 | |||||
| Bloc populaire | Rolland Angers | 10,215 | 30.6 | |||||
| Liberal | Joseph-Arthur Hamel | 8,027 | 24.0 | -14.8 | ||||
| Social Credit | David Maltais | 2,713 | 8.1 | |||||
| Independent | Jules Landry | 1,282 | 3.8 | |||||
| Co-operative Commonwealth | Antoine Brisson | 371 | 1.1 | |||||
| Total valid votes | 33,404 | 100.0 | ||||||
| 1940 Canadian federal election | ||||||||
|---|---|---|---|---|---|---|---|---|
| Party | Candidate | Votes | % | ±% | ||||
| Liberal | Alfred Dubuc | 8,693 | 38.8 | -8.5 | ||||
| National Government | François-Albert Dumas | 8,330 | 37.2 | -0.5 | ||||
| Independent Liberal | Eudore Boivin | 5,390 | 24.0 | |||||
| Total valid votes | 22,413 | 100.0 | ||||||
Note: "National Government" vote is compared to Conservative vote in 1935 election.
| 1935 Canadian federal election | ||||||||
|---|---|---|---|---|---|---|---|---|
| Party | Candidate | Votes | % | ±% | ||||
| Liberal | Alfred Dubuc | 9,685 | 47.3 | -4.9 | ||||
| Conservative | Joseph-Adam Lavergne | 7,719 | 37.7 | -10.1 | ||||
| Independent Liberal | Georges-Aimé Gagnon | 2,373 | 11.6 | |||||
| Unknown | Donat Demers | 690 | 3.4 | |||||
| Total valid votes | 20,467 | 100.0 | ||||||
| 1930 Canadian federal election | ||||||||
|---|---|---|---|---|---|---|---|---|
| Party | Candidate | Votes | % | ±% | ||||
| Liberal | Alfred Dubuc | 10,641 | 52.2 | -28.0 | ||||
| Conservative | Joseph-Adam Lavergne | 9,744 | 47.8 | +28.0 | ||||
| Total valid votes | 20,385 | 100.0 | ||||||
Note: Alfred Dubuc's popular vote as a Liberal candidate is compared to his popular vote as an independent Liberal candidate in the 1926 general election.
| 1926 Canadian federal election | ||||||||
|---|---|---|---|---|---|---|---|---|
| Party | Candidate | Votes | % | ±% | ||||
| Independent Liberal | Alfred Dubuc | 8,658 | 80.2 | +26.0 | ||||
| Conservative | Joseph Eugène Bergeron | 2,142 | 19.8 | +11.4 | ||||
| Total valid votes | 10,800 | 100.0 | ||||||
| 1925 Canadian federal election | ||||||||
|---|---|---|---|---|---|---|---|---|
| Party | Candidate | Votes | % | |||||
| Independent Liberal | Alfred Dubuc | 7,198 | 54.1 | |||||
| Liberal | Louis-Joseph Levesque | 4,981 | 37.5 | |||||
| Conservative | Jean-Charles Gagne | 1,120 | 8.4 | |||||
| Total valid votes | 13,299 | 100.0 | ||||||
See also
- List of Canadian federal electoral districts
- Past Canadian electoral districts
References
- "(Code 24016) Census Profile". 2011 census. Statistics Canada. 2012. Retrieved 2011-03-07.
- Campaign expense data from Elections Canada
- 2011 Results from Elections Canada
- Riding history from the Library of Parliament
Notes
- Statistics Canada: 2012
- Statistics Canada: 2012
- https://www12.statcan.gc.ca/census-recensement/2016/dp-pd/dt-td/Rp-eng.cfm?TABID=2&LANG=E&APATH=3&DETAIL=0&DIM=0&FL=A&FREE=0&GC=0&GK=0&GRP=1&PID=109983&PRID=10&PTYPE=109445&S=0&SHOWALL=0&SUB=0&Temporal=2016&THEME=118&VID=0&VNAMEE=&VNAMEF=
- "List of confirmed candidates". Elections Canada. Retrieved 3 October 2019.
- "Election night results". Elections Canada. Retrieved 22 October 2019.
- "Confirmed candidates for Chicoutimi—Le Fjord, 30 September 2015". Elections Canada. Retrieved 2018-06-19.
- Elections Canada – Preliminary Election Expenses Limits for Candidates Archived August 15, 2015, at the Wayback Machine
- Alice Funke. "Pundits' Guide to Canadian Elections". Punditsguide.ca. Retrieved 2018-06-19.