Shefford (electoral district)
Shefford is a federal electoral district in Quebec, Canada, that has been represented in the House of Commons of Canada since 1867. Its population in 2006 was 100,000.
 | |||
| Federal electoral district | |||
| Legislature | House of Commons | ||
| MP |
Bloc Québécois | ||
| District created | 1867 | ||
| First contested | 1867 | ||
| Last contested | 2019 | ||
| District webpage | profile, map | ||
| Demographics | |||
| Population (2011)[1] | 107,538 | ||
| Electors (2015) | 87,902 | ||
| Area (km²)[2] | 1,434 | ||
| Pop. density (per km²) | 75 | ||
| Census subdivisions | Granby, Shefford, Saint-Césaire, Waterloo, Roxton Pond, Saint-Alphonse, Saint-Paul-d'Abbotsford, Rougemont, Valcourt | ||
Demographics
Ethnic groups: 99.2% White
Languages: 95.2% French, 3.2% English
Religions: 90.3% Catholic, 3.8% Protestant, 4.7% No religious affiliation
Average income: $25,354
Geography
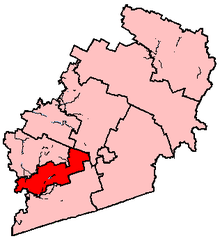
This southern Quebec riding extends from Sherbrooke in the east to Montreal in the west, straddling the Quebec regions of Montérégie and Estrie.
The district includes the central and eastern Rouville Regional County Municipality, all of La Haute-Yamaska (except Bromont) and southwestern Le Val-Saint-François Regional County Municipality. The main communities are Granby, Roxton Pond, Saint-Césaire, Saint-Alphonse, Valcourt, Waterloo, Saint-Paul-d'Abbotsford, Shefford, Granby Township, and Rougemont. The Area is 1,428 km2.
The neighbouring ridings are Brome—Missisquoi, Saint-Jean, Chambly—Borduas, Saint-Hyacinthe—Bagot, Drummond, and Richmond—Arthabaska.
History
The electoral district was created in the British North America Act of 1867.
The 2012 electoral redistribution saw this riding gain a small fraction of territory from Brome—Missisquoi.
Members of Parliament
This riding has elected the following Members of Parliament:
Election results
| 2019 Canadian federal election | ||||||||
|---|---|---|---|---|---|---|---|---|
| Party | Candidate | Votes | % | ±% | Expenditures | |||
| Bloc Québécois | Andréanne Larouche | 23,503 | 38.6 | |||||
| Liberal | Pierre Breton | 22,605 | 37.1 | |||||
| Conservative | Nathalie Clermont | 7,495 | 12.3 | |||||
| New Democratic | Raymonde Plamondon | 3,705 | 6.1 | |||||
| Green | Katherine Turgeon | 2,814 | 4.6 | |||||
| People's | Mariam Sabbagh | 497 | 0.8 | |||||
| Indépendence du Québec | Darlène Daviault | 294 | 0.5 | |||||
| Total valid votes/Expense limit | 60,913 | 100.0 | ||||||
| Total rejected ballots | 1,313 | |||||||
| Turnout | 62,226 | 68.4 | ||||||
| Eligible voters | 90,921 | |||||||
| Source: Elections Canada[3][4] | ||||||||
| 2015 Canadian federal election | ||||||||
|---|---|---|---|---|---|---|---|---|
| Party | Candidate | Votes | % | ±% | Expenditures | |||
| Liberal | Pierre Breton | 22,957 | 38.96 | +29.97 | $38,440.56 | |||
| New Democratic | Claire Mailhot | 13,945 | 23.67 | -27.42 | $59,455.32 | |||
| Bloc Québécois | Jocelyn Beaudoin | 13,092 | 22.22 | -1.15 | $34,737.83 | |||
| Conservative | Sylvie Fontaine | 7,529 | 12.78 | -1.87 | $22,193.17 | |||
| Green | Simon McMillan | 1,397 | 2.37 | +0.48 | – | |||
| Total valid votes/Expense limit | 58,920 | 100.00 | $228,694.19 | |||||
| Total rejected ballots | 1,299 | 2.16 | – | |||||
| Turnout | 60,219 | 68.16 | – | |||||
| Eligible voters | 88,355 | |||||||
| Liberal gain from New Democratic | Swing | +28.69 | ||||||
| Source: Elections Canada[5][6] | ||||||||
| 2011 federal election redistributed results[7] | |||
|---|---|---|---|
| Party | Vote | % | |
| New Democratic | 27,578 | 51.09 | |
| Bloc Québécois | 12,617 | 23.37 | |
| Conservative | 7,908 | 14.65 | |
| Liberal | 4,856 | 9.00 | |
| Green | 1,022 | 1.89 | |
| 2011 Canadian federal election | ||||||||
|---|---|---|---|---|---|---|---|---|
| Party | Candidate | Votes | % | ±% | Expenditures | |||
| New Democratic | Réjean Genest | 27,575 | 51.09 | +38.58 | ||||
| Bloc Québécois | Robert Vincent | 12,615 | 23.37 | 19.45 | ||||
| Conservative | Mélisa Leclerc | 7,908 | 14.65 | -4.98 | ||||
| Liberal | Bernard Demers | 4,855 | 8.99 | -12.39 | ||||
| Green | Patrick Daoust | 1,022 | 1.89 | -1.7 | ||||
| Total valid votes/Expense limit | 53,975 | 100.00 | ||||||
| Total rejected ballots | 877 | 1.60 | -0.33 | |||||
| Turnout | 54,852 | 64.94 | +1.80 | |||||
| Eligible voters | 84,464 | – | – | |||||
| 2008 Canadian federal election | ||||||||
|---|---|---|---|---|---|---|---|---|
| Party | Candidate | Votes | % | ±% | Expenditures | |||
| Bloc Québécois | Robert Vincent | 21,650 | 42.82 | -0.27 | $48,933 | |||
| Liberal | Bernard Demers | 10,810 | 21.38 | -2.04 | $16,716 | |||
| Conservative | Jean Lambert | 9,927 | 19.63 | -5.13 | $38,653 | |||
| New Democratic | Simon Gnocchini Messier | 6,323 | 12.51 | +7.78 | $7,035 | |||
| Green | Michel M. Champagne | 1,848 | 3.66 | -0.35 | ||||
| Total valid votes/Expense limit | 50,558 | 100.00 | $86,480 | |||||
| Total rejected ballots | 994 | 1.93 | ||||||
| Turnout | 51,552 | 63.14 | ||||||
| Bloc Québécois hold | Swing | +0.9 | ||||||
| 2006 Canadian federal election | ||||||||
|---|---|---|---|---|---|---|---|---|
| Party | Candidate | Votes | % | ±% | Expenditures | |||
| Bloc Québécois | Robert Vincent | 22,159 | 43.09 | -3.51 | $43,703 | |||
| Conservative | Jean Lambert | 12,734 | 24.76 | +16.84 | $52,890 | |||
| Liberal | Diane St-Jacques | 12,043 | 23.42 | -16.31 | $44,786 | |||
| New Democratic | Paula Maundcote | 2,431 | 4.73 | +2.30 | $1,540 | |||
| Green | Francine Brière | 2,061 | 4.01 | +0.68 | ||||
| Total valid votes/Expense limit | 51,428 | 100.00 | $79,318 | |||||
| Bloc Québécois hold | Swing | −9.9 | ||||||
| 2004 Canadian federal election | ||||||||
|---|---|---|---|---|---|---|---|---|
| Party | Candidate | Votes | % | ±% | Expenditures | |||
| Bloc Québécois | Robert Vincent | 21,968 | 46.60 | +2.65 | $41,344 | |||
| Liberal | Diane St-Jacques | 18,725 | 39.72 | -6.21 | $60,445 | |||
| Conservative | Jacques Parenteau | 3,732 | 7.92 | +0.45 | $6,910 | |||
| Green | Francine Brière | 1,571 | 3.33 | – | ||||
| New Democratic | Sonia Bisson | 1,146 | 2.43 | +1.59 | $400 | |||
| Total valid votes/Expense limit | 47,146 | 100.00 | $77,209 | |||||
Note: Conservative vote is compared to the total of the Canadian Alliance vote and Progressive Conservative vote in 2000 election.
| 2000 Canadian federal election | ||||||||
|---|---|---|---|---|---|---|---|---|
| Party | Candidate | Votes | % | ±% | ||||
| Liberal | Diane St-Jacques | 20,707 | 45.93 | +19.74 | ||||
| Bloc Québécois | Michel Benoit | 19,816 | 43.95 | +8.13 | ||||
| Alliance | Jean-Jacques Treyvaud | 1,867 | 4.14 | |||||
| Progressive Conservative | Audrey Castonguay | 1,498 | 3.32 | -33.58 | ||||
| Marijuana | Nicolas Cousineau | 819 | 1.82 | |||||
| New Democratic | Elizabeth Morey | 380 | 0.84 | -0.25 | ||||
| Total valid votes | 45,087 | 100.00 | ||||||
| 1997 Canadian federal election | ||||||||
|---|---|---|---|---|---|---|---|---|
| Party | Candidate | Votes | % | ±% | ||||
| Progressive Conservative | Diane St-Jacques | 17,897 | 36.90 | +25.10 | ||||
| Bloc Québécois | Jean H. Leroux | 17,376 | 35.82 | -19.60 | ||||
| Liberal | Chantal Gareau | 12,699 | 26.18 | -2.87 | ||||
| New Democratic | Karen Hurley | 531 | 1.09 | -0.11 | ||||
| Total valid votes | 48,503 | 100.00 | ||||||
| 1993 Canadian federal election | ||||||||
|---|---|---|---|---|---|---|---|---|
| Party | Candidate | Votes | % | ±% | ||||
| Bloc Québécois | Jean Leroux | 27,001 | 55.42 | |||||
| Liberal | Roger Légaré | 14,152 | 29.05 | -19.19 | ||||
| Progressive Conservative | Jocelyn Compagnat | 5,750 | 11.80 | -31.41 | ||||
| Natural Law | Michèle Beausoleil | 758 | 1.56 | |||||
| New Democratic | Marielle Sanna | 586 | 1.20 | -7.34 | ||||
| Abolitionist | Denis Loubier | 470 | 0.96 | |||||
| Total valid votes | 48,717 | 100.00 | ||||||
| 1988 Canadian federal election | ||||||||
|---|---|---|---|---|---|---|---|---|
| Party | Candidate | Votes | % | ±% | ||||
| Liberal | Jean Lapierre | 23,943 | 48.24 | +0.73 | ||||
| Progressive Conservative | Danielle Coté | 21,445 | 43.21 | +0.27 | ||||
| New Democratic | Paul Pearson | 4,242 | 8.55 | +1.89 | ||||
| Total valid votes | 49,630 | 100.00 | ||||||
| 1984 Canadian federal election | ||||||||
|---|---|---|---|---|---|---|---|---|
| Party | Candidate | Votes | % | ±% | ||||
| Liberal | Jean Lapierre | 25,483 | 47.51 | -20.96 | ||||
| Progressive Conservative | Denis Loubier | 23,028 | 42.94 | +22.18 | ||||
| New Democratic | Denis Boissé | 3,569 | 6.65 | -1.16 | ||||
| Parti nationaliste | Pierre C. Boivin | 1,552 | 2.89 | |||||
| Total valid votes | 53,632 | 100.00 | ||||||
| 1980 Canadian federal election | ||||||||
|---|---|---|---|---|---|---|---|---|
| Party | Candidate | Votes | % | ±% | ||||
| Liberal | Jean Lapierre | 32,449 | 68.47 | +17.00 | ||||
| Progressive Conservative | Armand Russell | 9,837 | 20.76 | -2.79 | ||||
| New Democratic | Denis Boissé | 3,701 | 7.81 | +5.76 | ||||
| Rhinoceros | Cornélius André Brazeau | 1,274 | 2.69 | +1.12 | ||||
| Marxist–Leninist | Gilles Davignon | 129 | 0.27 | |||||
| Total valid votes | 47,390 | 100.00 | ||||||
| 1979 Canadian federal election | ||||||||
|---|---|---|---|---|---|---|---|---|
| Party | Candidate | Votes | % | ±% | ||||
| Liberal | Jean Lapierre | 25,287 | 51.47 | +12.13 | ||||
| Progressive Conservative | Gérald R. Scott | 11,567 | 23.54 | +6.93 | ||||
| Independent | Gilbert Rondeau | 6,454 | 13.14 | |||||
| Social Credit | Murielle Audette | 3,922 | 7.98 | -33.64 | ||||
| New Democratic | Denis Boisse | 1,008 | 2.05 | -0.37 | ||||
| Rhinoceros | Lyse Dumouchel | 770 | 1.57 | |||||
| Union populaire | Gilles Maille | 121 | 0.25 | |||||
| Total valid votes | 49,129 | 100.00 | ||||||
| 1974 Canadian federal election | ||||||||
|---|---|---|---|---|---|---|---|---|
| Party | Candidate | Votes | % | ±% | ||||
| Social Credit | Gilbert Rondeau | 15,512 | 41.62 | -6.91 | ||||
| Liberal | Louis-Paul Neveu | 14,663 | 39.34 | +5.97 | ||||
| Progressive Conservative | Louis Grignon | 6,193 | 16.62 | +0.54 | ||||
| New Democratic | Terry Haig | 903 | 2.42 | +0.39 | ||||
| Total valid votes | 37,271 | 100.00 | ||||||
| 1972 Canadian federal election | ||||||||
|---|---|---|---|---|---|---|---|---|
| Party | Candidate | Votes | % | ±% | ||||
| Social Credit | Gilbert Rondeau | 18,803 | 48.53 | +7.89 | ||||
| Liberal | Louis-Paul Neveu | 12,928 | 33.37 | -5.75 | ||||
| Progressive Conservative | Guy Arseneault | 6,228 | 16.07 | -2.32 | ||||
| New Democratic | John Philip Penner | 786 | 2.03 | +0.18 | ||||
| Total valid votes | 38,745 | 100.00 | ||||||
Note: Social Credit vote is compared to Ralliement créditiste vote in the 1968 election.
| 1968 Canadian federal election | ||||||||
|---|---|---|---|---|---|---|---|---|
| Party | Candidate | Votes | % | ±% | ||||
| Ralliement créditiste | Gilbert Rondeau | 12,633 | 40.64 | +7.98 | ||||
| Liberal | Louis-Paul Neveu | 12,158 | 39.11 | +6.29 | ||||
| Progressive Conservative | Paul-O. Trépanier | 5,718 | 18.40 | -14.33 | ||||
| New Democratic | Jean Miller | 574 | 1.85 | |||||
| Total valid votes | 31,083 | 100.00 | ||||||
| 1965 Canadian federal election | ||||||||
|---|---|---|---|---|---|---|---|---|
| Party | Candidate | Votes | % | ±% | ||||
| Liberal | Louis-Paul Neveu | 9,494 | 32.82 | -3.97 | ||||
| Progressive Conservative | Paul-O. Trépanier | 9,467 | 32.73 | +13.82 | ||||
| Ralliement créditiste | Gilbert Rondeau | 9,447 | 32.66 | -5.18 | ||||
| Independent Liberal | Lucien Pearson | 518 | 1.79 | |||||
| Total valid votes | 28,926 | 100.00 | ||||||
Note: Ralliement créditiste vote is compared to Social Credit vote in the 1963 election.
| 1963 Canadian federal election | ||||||||
|---|---|---|---|---|---|---|---|---|
| Party | Candidate | Votes | % | ±% | ||||
| Social Credit | Gilbert Rondeau | 9,989 | 37.84 | -4.18 | ||||
| Liberal | Gérard Lacaille | 9,713 | 36.79 | +4.42 | ||||
| Progressive Conservative | Donat Marois | 4,991 | 18.91 | -6.70 | ||||
| New Democratic | Jacques Jourdenais | 1,706 | 6.46 | |||||
| Total valid votes | 26,399 | 100.00 | ||||||
| 1962 Canadian federal election | ||||||||
|---|---|---|---|---|---|---|---|---|
| Party | Candidate | Votes | % | ±% | ||||
| Social Credit | Gilbert Rondeau | 12,421 | 42.02 | |||||
| Liberal | Marcel Boivin | 9,570 | 32.37 | -17.72 | ||||
| Progressive Conservative | Claude Léveillé | 7,569 | 25.61 | -21.45 | ||||
| Total valid votes | 29,560 | 100.00 | ||||||
| 1958 Canadian federal election | ||||||||
|---|---|---|---|---|---|---|---|---|
| Party | Candidate | Votes | % | ±% | ||||
| Liberal | Marcel Boivin | 13,001 | 50.10 | -12.87 | ||||
| Progressive Conservative | Jacques Hannon | 12,211 | 47.05 | +10.02 | ||||
| Co-operative Commonwealth | Adrien Dumas | 739 | 2.85 | |||||
| Total valid votes | 25,951 | 100.00 | ||||||
| 1957 Canadian federal election | ||||||||
|---|---|---|---|---|---|---|---|---|
| Party | Candidate | Votes | % | ±% | ||||
| Liberal | Marcel Boivin | 14,897 | 62.97 | -5.13 | ||||
| Progressive Conservative | Hector Choquette | 8,760 | 37.03 | +5.13 | ||||
| Total valid votes | 23,657 | 100.00 | ||||||
| 1953 Canadian federal election | ||||||||
|---|---|---|---|---|---|---|---|---|
| Party | Candidate | Votes | % | ±% | ||||
| Liberal | Marcel Boivin | 15,409 | 68.10 | +8.81 | ||||
| Progressive Conservative | Jean-Louis Robert | 7,219 | 31.90 | -4.68 | ||||
| Total valid votes | 22,628 | 100.00 | ||||||
| 1949 Canadian federal election | ||||||||
|---|---|---|---|---|---|---|---|---|
| Party | Candidate | Votes | % | ±% | ||||
| Liberal | Marcel Boivin | 12,993 | 59.29 | +11.92 | ||||
| Progressive Conservative | Wilson Irwin | 8,017 | 36.58 | |||||
| Union des électeurs | Fernand Brodeur | 906 | 4.13 | 0.44 | ||||
| Total valid votes | 21,916 | 100.00 | ||||||
| 1945 Canadian federal election | ||||||||
|---|---|---|---|---|---|---|---|---|
| Party | Candidate | Votes | % | ±% | ||||
| Liberal | Marcel Boivin | 7,413 | 47.37 | -20.87 | ||||
| Bloc populaire | Lindor Tétreault | 4,212 | 26.92 | |||||
| Independent PC | Patrick Edward Delaney | 3,446 | 22.02 | |||||
| Social Credit | Elzéar Brodeur | 578 | 3.69 | |||||
| Total valid votes | 15,649 | 100.00 | ||||||
| 1940 Canadian federal election | ||||||||
|---|---|---|---|---|---|---|---|---|
| Party | Candidate | Votes | % | ±% | ||||
| Liberal | Joseph-Hermas Leclerc | 7,831 | 68.24 | +16.67 | ||||
| National Government | Hector Choquette | 3,644 | 31.76 | -16.67 | ||||
| Total valid votes | 11,475 | 100.00 | ||||||
Note: "National Government" vote is compared to Conservative vote in 1935 election.
| 1935 Canadian federal election | ||||||||
|---|---|---|---|---|---|---|---|---|
| Party | Candidate | Votes | % | ±% | ||||
| Liberal | Joseph-Hermas Leclerc | 6,925 | 51.58 | +7.90 | ||||
| Conservative | Sylva Lebrun | 6,502 | 48.42 | -7.90 | ||||
| Total valid votes | 13,427 | 100.00 | ||||||
| 1930 Canadian federal election | ||||||||
|---|---|---|---|---|---|---|---|---|
| Party | Candidate | Votes | % | ±% | ||||
| Conservative | J.-Eugène Tétreault | 7,064 | 56.32 | +20.20 | ||||
| Liberal | Pierre-Ernest Boivin | 5,478 | 43.68 | -20.20 | ||||
| Total valid votes | 12,542 | 100.00 | ||||||
| 1926 Canadian federal election | ||||||||
|---|---|---|---|---|---|---|---|---|
| Party | Candidate | Votes | % | ±% | ||||
| Liberal | Pierre-Ernest Boivin | 6,374 | 63.87 | +7.10 | ||||
| Conservative | Louis-Joseph Gauthier | 3,605 | 36.13 | -7.10 | ||||
| Total valid votes | 9,979 | 100.00 | ||||||
| 1925 Canadian federal election | ||||||||
|---|---|---|---|---|---|---|---|---|
| Party | Candidate | Votes | % | ±% | ||||
| Liberal | Georges Henri Boivin | 5,910 | 56.78 | -13.78 | ||||
| Conservative | James Davidson | 4,499 | 43.22 | |||||
| Total valid votes | 10,409 | 100.00 | ||||||
| 1921 Canadian federal election | ||||||||
|---|---|---|---|---|---|---|---|---|
| Party | Candidate | Votes | % | |||||
| Liberal | Georges Henri Boivin | 6,318 | 70.56 | |||||
| Independent | Hormisdas Beaudry | 2,636 | 29.44 | |||||
| Total valid votes | 8,954 | 100.00 | ||||||
| 1917 Canadian federal election | ||||||||
|---|---|---|---|---|---|---|---|---|
| Party | Candidate | Votes | ||||||
| Opposition (Laurier Liberals) | Georges Henri Boivin | acclaimed | ||||||
| 1911 Canadian federal election | ||||||||
|---|---|---|---|---|---|---|---|---|
| Party | Candidate | Votes | % | ±% | ||||
| Liberal | Georges Henri Boivin | 2,271 | 50.29 | -3.03 | ||||
| Conservative | James Davidson | 2,245 | 49.71 | +3.03 | ||||
| Total valid votes | 4,516 | 100.00 | ||||||
| 1908 Canadian federal election | ||||||||
|---|---|---|---|---|---|---|---|---|
| Party | Candidate | Votes | % | ±% | ||||
| Liberal | Henry Edgarton Allen | 2,465 | 53.32 | -4.25 | ||||
| Conservative | William H. Robinson | 2,158 | 46.68 | +4.25 | ||||
| Total valid votes | 4,623 | 100.00 | ||||||
| 1904 Canadian federal election | ||||||||
|---|---|---|---|---|---|---|---|---|
| Party | Candidate | Votes | % | ±% | ||||
| Liberal | Charles Henry Parmelee | 2,347 | 57.57 | +2.45 | ||||
| Conservative | Peter Munroe Hayes | 1,730 | 42.43 | -2.45 | ||||
| Total valid votes | 4,077 | 100.00 | ||||||
| 1900 Canadian federal election | ||||||||
|---|---|---|---|---|---|---|---|---|
| Party | Candidate | Votes | % | ±% | ||||
| Liberal | Charles Henry Parmelee | 2,314 | 55.12 | -0.81 | ||||
| Conservative | Alonzo Chown Savage | 1,884 | 44.88 | +0.81 | ||||
| Total valid votes | 4,198 | 100.00 | ||||||
| 1896 Canadian federal election | ||||||||
|---|---|---|---|---|---|---|---|---|
| Party | Candidate | Votes | % | ±% | ||||
| Liberal | C. H. Parmelee | 2,191 | 55.94 | +3.34 | ||||
| Conservative | P.J.I. Peltier | 1,726 | 44.06 | -3.34 | ||||
| Total valid votes | 3,917 | 100.00 | ||||||
| 1891 Canadian federal election | ||||||||
|---|---|---|---|---|---|---|---|---|
| Party | Candidate | Votes | % | ±% | ||||
| Liberal | J. R. Sanborn | 1,792 | 52.60 | |||||
| Conservative | A.C. Savage | 1,615 | 47.40 | -3.07 | ||||
| Total valid votes | 3,407 | 100.00 | ||||||
| 1887 Canadian federal election | ||||||||
|---|---|---|---|---|---|---|---|---|
| Party | Candidate | Votes | % | ±% | ||||
| Conservative | Antoine Audet | 1,671 | 50.47 | |||||
| Independent Liberal | M. Auger | 1,640 | 49.53 | -2.70 | ||||
| Total valid votes | 3,311 | 100.00 | ||||||
| 1882 Canadian federal election | ||||||||
|---|---|---|---|---|---|---|---|---|
| Party | Candidate | Votes | % | ±% | ||||
| Independent Liberal | Michel Auger | 1,581 | 52.23 | +42.76 | ||||
| Liberal | Lucius Seth Huntington | 1,446 | 47.77 | -1.46 | ||||
| Total valid votes | 3,027 | 100.00 | ||||||
| 1878 Canadian federal election | ||||||||
|---|---|---|---|---|---|---|---|---|
| Party | Candidate | Votes | % | ±% | ||||
| Liberal | Lucius Seth Huntington | 1,414 | 49.23 | +7.23 | ||||
| Unknown | R. Nicol | 1,186 | 41.30 | |||||
| Unknown | M. Auger | 272 | 9.47 | |||||
| Total valid votes | 2,872 | 100.00 | ||||||
| 1874 Canadian federal election | ||||||||
|---|---|---|---|---|---|---|---|---|
| Party | Candidate | Votes | % | ±% | ||||
| Liberal | Lucius Seth Huntington | 1,618 | 57.99 | +1.12 | ||||
| Unknown | J.J. Curran | 1,172 | 42.01 | |||||
| Total valid votes | 2,790 | 100.00 | ||||||
| 1872 Canadian federal election | ||||||||
|---|---|---|---|---|---|---|---|---|
| Party | Candidate | Votes | % | ±% | ||||
| Liberal | Lucius Seth Huntington | 1,515 | 56.87 | -0.19 | ||||
| Unknown | Charles Thibault | 1,149 | 43.13 | |||||
| Total valid votes | 2,664 | 100.00 | ||||||
| 1867 Canadian federal election | ||||||||
|---|---|---|---|---|---|---|---|---|
| Party | Candidate | Votes | % | |||||
| Liberal | Lucius Seth Huntington | 1,317 | 57.06 | |||||
| Unknown | Parmelee | 991 | 42.94 | |||||
| Total valid votes | 2,308 | 100.00 | ||||||
See also
- List of Canadian federal electoral districts
- Past Canadian electoral districts
References
- "(Code 24069) Census Profile". 2011 census. Statistics Canada. 2012. Retrieved 2011-03-07.
- Campaign expense data from Elections Canada
- Riding history from the Library of Parliament
- 2011 Results from Elections Canada
Notes
- Statistics Canada: 2012
- Statistics Canada: 2012
- "List of confirmed candidates". Elections Canada. Retrieved October 3, 2019.
- "Election Night Results". Elections Canada. Retrieved November 10, 2019.
- Elections Canada – Confirmed candidates for Shefford, 30 September 2015
- Elections Canada – Preliminary Election Expenses Limits for Candidates
- Pundits' Guide to Canadian Elections