South Ubian
South Ubian, officially the Municipality of South Ubian, is a 3rd class municipality in the province of Tawi-Tawi, Philippines. According to the 2015 census, it has a population of 25,935 people.[3]
South Ubian | |
|---|---|
| Municipality of South Ubian | |
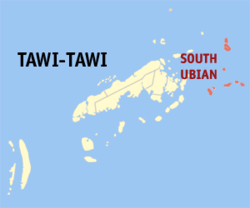 Map of Tawi-Tawi with South Ubian highlighted | |
OpenStreetMap 
| |
.svg.png) South Ubian Location within the Philippines | |
| Coordinates: 5°11′N 120°29′E | |
| Country | |
| Region | Bangsamoro Autonomous Region in Muslim Mindanao (BARMM) |
| Province | Tawi-Tawi |
| District | Lone District |
| Barangays | 31 (see Barangays) |
| Government | |
| • Type | Sangguniang Bayan |
| • Mayor | Hadzri H. Matba |
| • Vice Mayor | Abdurajack H. Sandag |
| • Congressman | Rashidin H. Matba |
| • Electorate | 12,503 voters (2019) |
| Area | |
| • Total | 272.04 km2 (105.04 sq mi) |
| Population (2015 census)[3] | |
| • Total | 25,935 |
| • Density | 95/km2 (250/sq mi) |
| • Households | 3,707 |
| Economy | |
| • Income class | 3rd municipal income class |
| • Poverty incidence | % (2015)[4] |
| • Revenue (₱) | 93,727,681.28 (2016) |
| Time zone | UTC+8 (PST) |
| ZIP code | 7504 |
| PSGC | |
| IDD : area code | +63 (0)68 |
| Climate type | tropical climate |
| Native languages | Sama language Tagalog |
| Website | www |
Barangays
South Ubian is politically subdivided into 31 barangays.
- Babagan
- Bengkol
- Bintawlan
- Boheh
- Bubuan
- Bunay Bunay Tong
- Bunay Bunay Lookan
- Bunay Bunay Center
- Lahad Dampong
- East Talisay
- Laitan
- Lambi-lambian
- Laud
- Likud Dampong
- Likud Egang
- Nunuk
- Nusa-nusa
- Nusa
- Pampang
- Putat
- Sollogan
- Tampakan Dampong
- Tangngah
- Tinda-tindahan
- Tong Tampakan
- Tubig Dayang Center
- Tubig Dayang Riverside
- Tubig Dayang
- Tukkai
- West Talisay
- Unas-unas
Climate
| Climate data for South Ubian, Tawi-Tawi | |||||||||||||
|---|---|---|---|---|---|---|---|---|---|---|---|---|---|
| Month | Jan | Feb | Mar | Apr | May | Jun | Jul | Aug | Sep | Oct | Nov | Dec | Year |
| Average high °C (°F) | 29 (84) |
29 (84) |
29 (84) |
30 (86) |
30 (86) |
30 (86) |
29 (84) |
30 (86) |
30 (86) |
30 (86) |
29 (84) |
29 (84) |
30 (85) |
| Average low °C (°F) | 25 (77) |
24 (75) |
24 (75) |
25 (77) |
25 (77) |
25 (77) |
25 (77) |
25 (77) |
25 (77) |
25 (77) |
25 (77) |
25 (77) |
25 (77) |
| Average precipitation mm (inches) | 157 (6.2) |
115 (4.5) |
123 (4.8) |
96 (3.8) |
136 (5.4) |
120 (4.7) |
104 (4.1) |
89 (3.5) |
86 (3.4) |
131 (5.2) |
151 (5.9) |
159 (6.3) |
1,467 (57.8) |
| Average rainy days | 20.4 | 17.5 | 20.4 | 21.1 | 26.7 | 25.7 | 26.0 | 24.5 | 24.0 | 27.7 | 26.3 | 24.7 | 285 |
| Source: Meteoblue [5] | |||||||||||||
Demographics
| Year | Pop. | ±% p.a. |
|---|---|---|
| 1903 | 6,410 | — |
| 1918 | 8,944 | +2.25% |
| 1939 | 8,052 | −0.50% |
| 1948 | 10,286 | +2.76% |
| 1960 | 11,308 | +0.79% |
| 1970 | 12,749 | +1.21% |
| 1975 | 16,241 | +4.97% |
| 1980 | 17,356 | +1.34% |
| 1990 | 19,191 | +1.01% |
| 1995 | 20,180 | +0.95% |
| 2000 | 27,301 | +6.69% |
| 2007 | 32,986 | +2.64% |
| 2010 | 27,741 | −6.11% |
| 2015 | 25,935 | −1.27% |
| Source: Philippine Statistics Authority[3][6][7][8] | ||
References
- "Municipality". Quezon City, Philippines: Department of the Interior and Local Government. Retrieved 31 May 2013.
- "Province: Tawi-tawi". PSGC Interactive. Quezon City, Philippines: Philippine Statistics Authority. Retrieved 12 November 2016.
- Census of Population (2015). "ARMM – Autonomous Region in Muslim Mindanao". Total Population by Province, City, Municipality and Barangay. PSA. Retrieved 20 June 2016.
- "PSA releases the 2015 Municipal and City Level Poverty Estimates". Quezon City, Philippines. Retrieved 12 October 2019.
- "South Ubian, Tawi-Tawi : Average Temperatures and Rainfall". Meteoblue. Retrieved 30 January 2019.
- Census of Population and Housing (2010). "ARMM – Autonomous Region in Muslim Mindanao". Total Population by Province, City, Municipality and Barangay. NSO. Retrieved 29 June 2016.
- Censuses of Population (1903–2007). "ARMM – Autonomous Region in Muslim Mindanao". Table 1. Population Enumerated in Various Censuses by Province/Highly Urbanized City: 1903 to 2007. NSO.
- "Province of Tawi‑tawi". Municipality Population Data. Local Water Utilities Administration Research Division. Retrieved 17 December 2016.
External links
- South Ubian Profile at PhilAtlas.com
- Philippine Standard Geographic Code
- Philippine Census Information
Places adjacent to South Ubian | ||||||||||
|---|---|---|---|---|---|---|---|---|---|---|
| ||||||||||
Bongao (capital) | |
| Municipalities | |
This article is issued from Wikipedia. The text is licensed under Creative Commons - Attribution - Sharealike. Additional terms may apply for the media files.