Gard's 2nd constituency
The 2nd constituency of Gard is a French legislative constituency in the Gard département.
constituency | |||
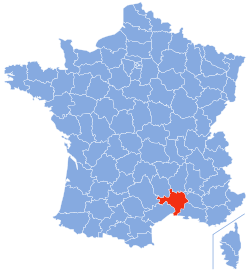
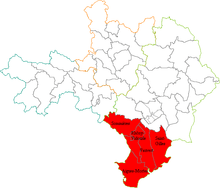 Location of constituency in Department | |||
 | |||
| Deputy |
| ||
|---|---|---|---|
| Department | Gard | ||
| Cantons | Aigues-Mortes, Rhôny-Vidourle, Saint-Gilles, Sommières, Vauvert | ||
| Registered voters | 145,273 | ||
Deputies
| Election | Member | Party | Notes | |
|---|---|---|---|---|
| 1988 | Jean-Marie Cambacérès | PS | ||
| 1993 | Jean-Marie André | UDF | ||
| 1997 | Alain Fabre-Pujol | PS | ||
| 2002 | Étienne Mourrut | UMP | ||
| 2007 | ||||
| 2012 | Gilbert Collard | FN | ||
| 2017 | Elected to the European Parliament and thus left National Assembly in January 2019 | |||
| 2020 | Nicolas Meizonnet | RN | Substitute, but entry into office delayed by appeal against validity of his election. | |
Election results
2017
| Candidate | Label | First round | Second round | |||
|---|---|---|---|---|---|---|
| Votes | % | Votes | % | |||
| Gilbert Collard | FN | 13,991 | 32.27 | 19,834 | 50.16 | |
| Marie Sara | MoDem | 13,943 | 32.16 | 19,711 | 49.84 | |
| Pascale Mourrut | LR | 6,165 | 14.22 | |||
| Danielle Floutier | FI | 5,665 | 13.07 | |||
| Béatrice Leccia | ECO | 1,296 | 2.99 | |||
| Rodolphe Brun | ECO | 594 | 1.37 | |||
| Geneviève Bourrely | DLF | 502 | 1.16 | |||
| Julie Schlumberger | DIV | 384 | 0.89 | |||
| Stéphane Manson | EXG | 318 | 0.73 | |||
| Christel Médiavilla | EXD | 284 | 0.66 | |||
| Nathalie Juchors | DIV | 214 | 0.49 | |||
| Timothy Broadbent | ECO | 0.00 | ||||
| Votes | 43,356 | 100.00 | 39,545 | 100.00 | ||
| Valid votes | 43,356 | 97.88 | 39,545 | 92.15 | ||
| Blank votes | 608 | 1.37 | 2,322 | 5.41 | ||
| Null votes | 330 | 0.75 | 1,048 | 2.44 | ||
| Turnout | 44,294 | 49.76 | 42,915 | 48.21 | ||
| Abstentions | 44,726 | 50.24 | 46,101 | 51.79 | ||
| Registered voters | 89,020 | 89,016 | ||||
| Source: Ministry of the Interior | ||||||
2012
| Candidate | Party | First round | Second round | ||||||||
|---|---|---|---|---|---|---|---|---|---|---|---|
| Votes | % | Votes | % | ||||||||
| Gilbert Collard | FN | 17,826 | 34.57% | 22,780 | 42.82% | ||||||
| Katy Guyot | PS–EELV | 16,948 | 32.87% | 22,110 | 41.56% | ||||||
| Etienne Mourrut | UMP | 12,318 | 23.89% | 8,313 | 15.63% | ||||||
| Danielle Floutier | FG | 2,672 | 5.18% | ||||||||
| Auguste Victoria | EELV dissident | 505 | 0.98% | ||||||||
| Jacqueline Abello Boyer | ?? | 417 | 0.81% | ||||||||
| Dorothée Martinerie | DLR | 334 | 0.65% | ||||||||
| James Climent | PP | 209 | 0.41% | ||||||||
| Carole Jourdan | AEI | 167 | 0.32% | ||||||||
| Stéphane Manson | LO | 164 | 0.32% | ||||||||
| Jean-Michel Sposito | 0.00% | ||||||||||
| Valid votes | 51,560 | 98.85% | 53,203 | 98.71% | |||||||
| Spoilt and null votes | 598 | 1.15% | 694 | 1.29% | |||||||
| Votes cast / turnout | 52,158 | 63.36% | 53,897 | 65.48% | |||||||
| Abstentions | 30,159 | 36.64% | 28,414 | 34.52% | |||||||
| Registered voters | 82,317 | 100.00% | 82,311 | 100.00% | |||||||
Sources
- French Interior Ministry results website: "Résultats électoraux officiels en France" (in French).
- "Résultats des élections législatives 2012" [Results of 2012 Legislative Election] (in French). Ministry of the Interior.
This article is issued from Wikipedia. The text is licensed under Creative Commons - Attribution - Sharealike. Additional terms may apply for the media files.