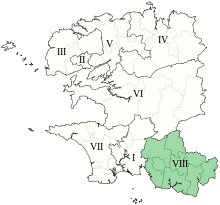
Finistère's 8th constituency
The 8th constituency of Finistère is a French legislative constituency in the Finistère département. Like the other 576 French constituencies, it elects one MP using the two-round system, with a run-off if no candidate receives over 50% of the vote in the first round.
constituency | |||
 Constituency in department | |||
 | |||
| Deputy |
| ||
|---|---|---|---|
| Department | Finistère | ||
| Cantons | d’Arzano, Bannalec, Concarneau, Pont-Aven, Quimperlé, Rosporden, Scaër | ||
Deputies
| Election | Member | Party | |
|---|---|---|---|
| 1958 | Louis Orvoën | MRP | |
| 1968 | Jean-Claude Petit | RI | |
| 1973 | Louis Le Pensec | PS | |
| 1986 | Proportional representation - no election by constituency | ||
| 1988 | Louis Le Pensec | PS | |
| 2002 | Gilbert Le Bris | PS | |
| 2007 | |||
| 2012 | |||
| 2017 | Erwan Balanant | REM | |
Election results
2017
| Candidate | Label | First round | Second round | |||
|---|---|---|---|---|---|---|
| Votes | % | Votes | % | |||
| Erwan Balanant | REM | 15,458 | 33.42 | 18,233 | 51.45 | |
| Michael Quernez | PS | 8,417 | 18.20 | 17,203 | 48.55 | |
| Emmanuel Magnan | FI | 6,001 | 12.97 | |||
| Laëtitia Boidin | LR | 4,564 | 9.87 | |||
| Mikaël Caréo | FN | 4,481 | 9.69 | |||
| Marie-Andrée Jérôme-Clovis | ECO | 1,842 | 3.98 | |||
| Jacques Rannou | PCF | 1,417 | 3.06 | |||
| Atto Dossena | DVD | 1,072 | 2.32 | |||
| Yann Pelliet | REG | 1,063 | 2.30 | |||
| Joseph Pichon | DLF | 600 | 1.30 | |||
| Denis Madelaine-Nicot | REG | 391 | 0.85 | |||
| Anne Morel | EXG | 371 | 0.80 | |||
| Catherine Mercier | DIV | 341 | 0.74 | |||
| Didier Troude | DVG | 233 | 0.50 | |||
| Votes | 46,251 | 100.00 | 35,436 | 100.00 | ||
| Valid votes | 46,251 | 97.64 | 35,436 | 88.77 | ||
| Blank votes | 795 | 1.68 | 3,024 | 7.58 | ||
| Null votes | 321 | 0.68 | 1,460 | 3.66 | ||
| Turnout | 47,367 | 54.32 | 39,920 | 45.78 | ||
| Abstentions | 39,838 | 45.68 | 47,281 | 54.22 | ||
| Registered voters | 87,205 | 87,201 | ||||
| Source: Ministry of the Interior | ||||||
2012
| Candidate | Party | First round | Second round | ||||||||
|---|---|---|---|---|---|---|---|---|---|---|---|
| Votes | % | Votes | % | ||||||||
| Gilbert Le Bris | PS | 24,092 | 48.58% | 30,844 | 65.78% | ||||||
| Atto Dossena | UMP | 10,527 | 21.23% | 16,043 | 34.22% | ||||||
| Gilles Ebroussard | FN | 4,461 | 9.00% | ||||||||
| Marcel Tilly | FG | 3,246 | 6.55% | ||||||||
| Stéphane Lefloch | EELV | 2,651 | 5.35% | ||||||||
| Erwan Balanant | MoDem | 2,171 | 4.38% | ||||||||
| Isabelle Moign | UDB | 632 | 1.27% | ||||||||
| Hervé Vanzande | NC | 428 | 0.86% | ||||||||
| Françoise Pontigny Lucas | PCD | 421 | 0.85% | ||||||||
| Anne-Marie Rimbault | JB (BNAFET) | 296 | 0.60% | ||||||||
| Anne Morel | LO | 279 | 0.56% | ||||||||
| Annie Menvielle | POI | 217 | 0.44% | ||||||||
| Roland Dufleit | GE | 168 | 0.34% | ||||||||
| Valid votes | 49,589 | 98.29% | 46,887 | 96.08% | |||||||
| Spoilt and null votes | 865 | 1.71% | 1,912 | 3.92% | |||||||
| Votes cast / turnout | 50,454 | 59.75% | 48,799 | 57.80% | |||||||
| Abstentions | 33,984 | 40.25% | 35,623 | 42.20% | |||||||
| Registered voters | 84,438 | 100.00% | 84,422 | 100.00% | |||||||
2007
| Party | Candidate | Votes | % | ± | |
|---|---|---|---|---|---|
| PS | Gilbert Le Bris | 29,023 | 53,48 | +2.51 | |
| UMP | Jeanne-Yvonne Triché | 25,247 | 46.52 | -2.51 | |
| Turnout | 54,270 | 68.24 | |||
| PS hold | Swing | ||||
Sources
- Official results of French elections from 1998: "Résultats électoraux officiels en France" (in French). Archived from the original on 2011-12-20.
- "Résultats des élections législatives 2012" [Results of 2012 Legislative Election] (in French). Ministry of the Interior.
This article is issued from Wikipedia. The text is licensed under Creative Commons - Attribution - Sharealike. Additional terms may apply for the media files.