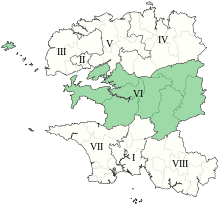
Finistère's 6th constituency
The 6th constituency of Finistère is a French legislative constituency in the Finistère département. Like the other 576 French constituencies, it elects one MP using the two-round system, with a run-off if no candidate receives over 50% of the vote in the first round.
constituency | |||
 Constituency in department | |||
 | |||
| Deputy |
| ||
|---|---|---|---|
| Department | Finistère | ||
| Cantons | Carhaix-Plouguer, Châteaulin, Châteauneuf-du-Faou, Crozon, Daoulas, Le Faou, Huelgoat, Ouessant, Pleyben | ||
Historic representation
| Election | Member | Party | |
|---|---|---|---|
| 1988 | Jean-Yves Cozan | UDF | |
| 1997 | Kofi Yamgnane | PS | |
| 2002 | Christian Ménard | UMP | |
| 2007 | |||
| 2012 | Richard Ferrand | PS | |
| 2017 | LREM | ||
Election results
2017
| Candidate | Label | First round | Second round | |||
|---|---|---|---|---|---|---|
| Votes | % | Votes | % | |||
| Richard Ferrand | REM | 17,230 | 33.93 | 20,991 | 56.53 | |
| Gaëlle Nicolas | LR | 9,193 | 18.10 | 16,140 | 43.47 | |
| Christian Troadec | REG | 7,047 | 13.88 | |||
| Jean-Michel Lucas | FI | 5,855 | 11.53 | |||
| Nathanaël Legeard | ECO | 4,360 | 8.59 | |||
| Patrick Le Fur | FN | 3,523 | 6.94 | |||
| Lionel Chabrol | DIV | 773 | 1.52 | |||
| Maxime Paul | PCF | 711 | 1.40 | |||
| Sophie Rossigneux | DLF | 584 | 1.15 | |||
| Bernard Fehringer | DIV | 405 | 0.80 | |||
| Robert Béra | DVG | 307 | 0.60 | |||
| Élisabeth Piro | EXG | 292 | 0.58 | |||
| Catherine Carpentier | DIV | 264 | 0.52 | |||
| Jean Queinnec | EXD | 233 | 0.46 | |||
| Votes | 50,777 | 100.00 | 37,131 | 100.00 | ||
| Valid votes | 50,777 | 97.83 | 37,131 | 86.22 | ||
| Blank votes | 770 | 1.48 | 4,327 | 10.05 | ||
| Null votes | 355 | 0.68 | 1,607 | 3.73 | ||
| Turnout | 51,902 | 58.14 | 43,065 | 48.24 | ||
| Abstentions | 37,372 | 41.86 | 46,204 | 51.76 | ||
| Registered voters | 89,274 | 89,269 | ||||
| Source: Ministry of the Interior | ||||||
2012
| Candidate | Party | First round | Second round | ||||||||
|---|---|---|---|---|---|---|---|---|---|---|---|
| Votes | % | Votes | % | ||||||||
| Richard Ferrand | PS | 18,300 | 32.29% | 31,965 | 58.36% | ||||||
| Dominique Cap | UMP | 15,733 | 27.76% | 22,807 | 41.64% | ||||||
| Christian Troadec | PS dissident–MBP | 11,286 | 19.92% | ||||||||
| Marie-Anne Haas | FN | 4,312 | 7.61% | ||||||||
| Noëlle Péoc'h | FG | 2,999 | 5.29% | ||||||||
| Jocelyne Leclerc | EELV | 2,118 | 3.74% | ||||||||
| Marie Laurent | PCD | 636 | 1.12% | ||||||||
| André Ménesguen | NPA | 556 | 0.98% | ||||||||
| Sophie Rossigneux | DLR | 540 | 0.95% | ||||||||
| Élisabeth Piro | LO | 188 | 0.33% | ||||||||
| Valid votes | 56,668 | 98.79% | 54,772 | 96.79% | |||||||
| Spoilt and null votes | 695 | 1.21% | 1,814 | 3.21% | |||||||
| Votes cast / turnout | 57,363 | 64.17% | 56,586 | 63.33% | |||||||
| Abstentions | 32,033 | 35.83% | 32,769 | 36.67% | |||||||
| Registered voters | 89,396 | 100.00% | 89,355 | 100.00% | |||||||
2007
| Party | Candidate | Votes | % | ± | |
|---|---|---|---|---|---|
| UMP | Christian Ménard | 29,903 | 50.19 | ||
| PS | Richard Ferrand | 29,673 | 49.81 | ||
| Turnout | 61,127 | 68.92 | |||
| UMP hold | Swing | ||||
Sources
- Official results of French elections from 1998: "Résultats électoraux officiels en France" (in French). Archived from the original on 2011-12-20.
This article is issued from Wikipedia. The text is licensed under Creative Commons - Attribution - Sharealike. Additional terms may apply for the media files.