Finistère's 1st constituency
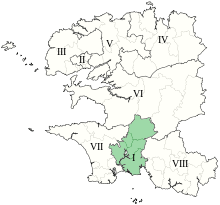
The 1st constituency of Finistère is a French legislative constituency in the Finistère département. Like the other 576 French constituencies, it elects one MP using the two-round system, with a run-off if no candidate receives over 50% of the vote in the first round.
constituency | |||
 Constituency in department | |||
 | |||
| Deputy |
| ||
|---|---|---|---|
| Department | Finistère | ||
| Cantons | Briec, Fouesnant, Quimper-1, Quimper-2, Quimper-3 | ||
Deputies
| Election | Member | Party | |
|---|---|---|---|
| 1958 | Hervé Nader | UNR | |
| 1962 | Roger Evrard | UNR | |
| 1967 | Edmond Michelet | UDR | |
| 1973 | Marc Bécam | UDR | |
| 1978 | Marc Bécam | RPR | |
| 1981 | Bernard Poignant | PS | |
| 1986 | Proportional representation - no election by constituency | ||
| 1988 | Bernard Poignant | PS | |
| 1993 | André Angot | RPR | |
| 2002 | Marcelle Ramonet | UMP | |
| 2007 | Jean-Jacques Urvoas | PS | |
| 2012 | |||
| 2017 | Annaïg Le Meur | REM | |
Election results
2017
| Candidate | Label | First round | Second round | |||
|---|---|---|---|---|---|---|
| Votes | % | Votes | % | |||
| Annaïg Le Meur | REM | 18,980 | 38.21 | 20,925 | 54.45 | |
| Jean-Jacques Urvoas | PS | 9,822 | 19.77 | 17,502 | 45.55 | |
| Claire Levry-Gérard | UDI | 5,896 | 11.87 | |||
| Jugdeep Harvinder | FI | 4,946 | 9.96 | |||
| Christel Hénaff | FN | 3,057 | 6.15 | |||
| Jean-Pierre Bigorgne | ECO | 2,325 | 4.68 | |||
| Christian Rose | DVD | 1,091 | 2.20 | |||
| Yves Brun | REG | 1,007 | 2.03 | |||
| Yvonne Rainero | PCF | 590 | 1.19 | |||
| Jeannine Le Du | DLF | 550 | 1.11 | |||
| Alain Rousseau | EXD | 417 | 0.84 | |||
| Uisant Créquer | DVG | 407 | 0.82 | |||
| Marie-Françoise Mao | DIV | 298 | 0.60 | |||
| Serge Hardy | EXG | 293 | 0.59 | |||
| Votes | 49,679 | 100.00 | 38,427 | 100.00 | ||
| Valid votes | 49,679 | 98.22 | 38,427 | 90.99 | ||
| Blank votes | 597 | 1.18 | 2,639 | 6.25 | ||
| Null votes | 304 | 0.60 | 1,164 | 2.76 | ||
| Turnout | 50,580 | 56.92 | 42,230 | 47.52 | ||
| Abstentions | 38,281 | 43.08 | 46,636 | 52.48 | ||
| Registered voters | 88,861 | 88,866 | ||||
| Source: Ministry of the Interior[1] | ||||||
2012
| Candidate | Party | First round | Second round | ||||||||
|---|---|---|---|---|---|---|---|---|---|---|---|
| Votes | % | Votes | % | ||||||||
| Jean-Jacques Urvoas | PS | 25,959 | 49.38% | 31,566 | 62.74% | ||||||
| Georges-Philippe Fontaine | UMP | 14,335 | 27.27% | 18,743 | 37.26% | ||||||
| Alain Rousseau | FN | 3,757 | 7.15% | ||||||||
| Martine Petit | EELV | 2,775 | 5.28% | ||||||||
| André Bernard | FG | 2,590 | 4.93% | ||||||||
| Corine Nicolas | MoDem | 1,399 | 2.66% | ||||||||
| Pierre Langlais | PR | 897 | 1.71% | ||||||||
| Hubert Bodin | PCD | 596 | 1.13% | ||||||||
| Serge Hardy | LO | 248 | 0.47% | ||||||||
| Silviane Le Menn | 9 | 0.02% | |||||||||
| Valid votes | 52,565 | 98.54% | 50,309 | 97.09% | |||||||
| Spoilt and null votes | 781 | 1.46% | 1,509 | 2.91% | |||||||
| Votes cast / turnout | 53,346 | 62.09% | 51,818 | 60.32% | |||||||
| Abstentions | 32,571 | 37.91% | 34,081 | 39.68% | |||||||
| Registered voters | 85,917 | 100.00% | 85,899 | 100.00% | |||||||
2007
| Party | Candidate | Votes | % | ± | |
|---|---|---|---|---|---|
| PS | Jean-Jacques Urvoas | 29,539 | 53.12 | +5.02 | |
| UMP | Marcelle Ramonet | 27,122 | 47.87 | -5.02 | |
| Turnout | 56,661 | 68.41 | |||
| PS gain from UMP | Swing | ||||
Sources
- Official results of French elections from 1998: "Résultats électoraux officiels en France" (in French). Archived from the original on 2011-12-20.
References
- "Résultats des élections législatives 2017" [Results of 2017 Legislative Election] (in French). Ministry of the Interior.
- "Résultats des élections législatives 2012" [Results of 2012 Legislative Election] (in French). Ministry of the Interior.
This article is issued from Wikipedia. The text is licensed under Creative Commons - Attribution - Sharealike. Additional terms may apply for the media files.