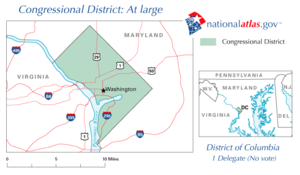
District of Columbia's at-large congressional district
The District of Columbia's at-large congressional district is a congressional district based entirely of the District of Columbia. According to the U.S. Constitution, only states may be represented in the Congress of the United States. The District of Columbia is not a U.S. state and therefore has no voting representation. Instead, constituents in the district elect a non-voting delegate to the U.S. House of Representatives. Unlike residents of U.S. territories, who also elect non-voting delegates to the Congress, D.C. residents pay federal income tax, which essentially subjects them to taxation without representation.
| District of Columbia's at-large congressional district | |||
|---|---|---|---|
 | |||
| Delegate |
| ||
| Area | 61 sq mi (160 km2) | ||
| Distribution |
| ||
| Population (2019) | 705,749 | ||
| Median income | $82,372[1] | ||
| Ethnicity |
| ||
| Occupation |
| ||
| Cook PVI | D+43[2][3] | ||
District of Columbia
|
|---|
 |
| This article is part of a series on the politics and government of District of Columbia |
|
Governance
|
|
Elections
|
|
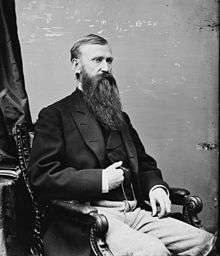
Despite lacking full voting privileges on the floor of the House of Representatives, delegates are voting members in U.S. Congressional committees and they lobby their congressional colleagues regarding the District's interests. While the office was initially created during the Reconstruction Era by the Radical Republicans, Norton P. Chipman (R) briefly held the seat for less than two terms before the office was eliminated completely. The District of Columbia Delegate Act Pub.L. 91–405, 84 Stat. 845-2 of 1970 authorized voters in the District of Columbia to elect one non-voting delegate to represent them in the United States House of Representatives.[4] The act was approved by Congress on September 22, 1970 and subsequently signed into law by President Richard Nixon. Democrat Walter E. Fauntroy was elected as the district's delegate to Congress in a March 1971 special election, receiving 58 percent of the 116,635 votes cast.[5]
Since 1993, when the House of Representatives has been under Democratic control, delegates, including the District of Columbia's delegate, have been allowed to cast non-binding floor votes when the House of Representatives was operating in the Committee of the Whole.[6][7]
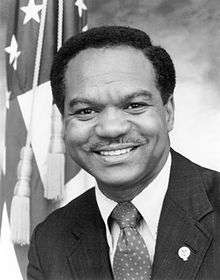
The district is currently represented by Democrat Eleanor Holmes Norton.
List of delegates representing the district
.jpg)
Election results
1870s
| Party | Candidate | Votes | % | ± | |
|---|---|---|---|---|---|
| Republican | Norton P. Chipman | 15,196 | N/A | ||
| Democratic | Richard T. Merrick | 11,104 | N/A | ||
| Republican win (new seat) | |||||
| Party | Candidate | Votes | % | ± | |
|---|---|---|---|---|---|
| Republican | Norton P. Chipman (inc.) | 12,443 | |||
| Democratic | L.G. Hine | 7,042 | |||
| Republican hold | Swing | {{{swing}}} | |||
1970s
| Party | Candidate | Votes | % | ||
|---|---|---|---|---|---|
| Democratic | Walter E. Fauntroy | 68,166 | 58.44 | ||
| Republican | John A. Nevius | 29,249 | 25.08 | ||
| D.C. Statehood Green | Julius Hobson | 15,427 | 13.23 | ||
| Independent | Frank Kameny | 1,888 | 1.62 | ||
| Independent | Douglas Moore | 1,301 | 1.12 | ||
| Socialist Workers | James E. Harris | 431 | 0.37 | ||
| No party | Write-ins | 173 | 0.15 | ||
| Total votes | 116,635 | 100.00 | |||
| Turnout | |||||
| Democratic win (new seat) | |||||
| Party | Candidate | Votes | % | |
|---|---|---|---|---|
| Democratic | Walter E. Fauntroy (inc.) | 95,300 | 60.64 | |
| Republican | William Chin-Lee | 39,487 | 25.12 | |
| D.C. Statehood Green | Charles I. Cassell | 18,730 | 11.92 | |
| Independent | David H. Dabney | 2,514 | 1.60 | |
| Socialist Workers | Herman Fagg | 1,133 | 0.72 | |
| Total votes | 157,164 | 100.00 | ||
| Turnout | ||||
| Democratic hold | ||||
| Party | Candidate | Votes | % | |
|---|---|---|---|---|
| Democratic | Walter E. Fauntroy (inc.) | 66,337 | 63.78 | |
| Independent | James G. Banks | 21,874 | 21.03 | |
| Republican | William R. Phillips | 9,166 | 8.81 | |
| D.C. Statehood Green | Anton V. Wood | 3,039 | 2.92 | |
| U.S. Labor | Susan Pennington | 1,813 | 1.74 | |
| Independent | David H. Dabney | 1,539 | 1.48 | |
| No party | Write-ins | 246 | 0.24 | |
| Total votes | 104,014 | 100.00 | ||
| Turnout | ||||
| Democratic hold | ||||
| Party | Candidate | Votes | % | |
|---|---|---|---|---|
| Democratic | Walter E. Fauntroy (inc.) | 12,149 | 77.18 | |
| Republican | Daniel L. Hall | 1,566 | 9.95 | |
| D.C. Statehood Green | Louis S. Aronica | 1,076 | 6.84 | |
| Socialist Workers | Charlotte J. Reavis | 499 | 3.17 | |
| U.S. Labor | Susan Pennington | 377 | 2.39 | |
| No party | Write-ins | 75 | 0.48 | |
| Total votes | 15,742 | 100.00 | ||
| Turnout | ||||
| Democratic hold | ||||
| Party | Candidate | Votes | % | |
|---|---|---|---|---|
| Democratic | Walter E. Fauntroy (inc.) | 76,557 | 79.59 | |
| Republican | Jackson R. Champion | 11,677 | 12.02 | |
| D.C. Statehood Green | Gregory Rowe | 3,886 | 4.04 | |
| Socialist Workers | Charlotte J. Reavis | 1,649 | 1.71 | |
| U.S. Labor | Cloid John Green | 1,064 | 1.10 | |
| No party | Write-ins | 1,473 | 1.53 | |
| Total votes | 96,306 | 100.00 | ||
| Turnout | ||||
| Democratic hold | ||||
1980s
| Party | Candidate | Votes | % | |
|---|---|---|---|---|
| Democratic | Walter E. Fauntroy (inc.) | 111,631 | 74.44 | |
| Republican | Robert J. Roehr | 21,021 | 14.02 | |
| D.C. Statehood Green | Josephine D. Butler | 14,325 | 9.55 | |
| No party | Write-ins | 2,979 | 1.99 | |
| Total votes | 149,956 | 100.00 | ||
| Turnout | ||||
| Democratic hold | ||||
| Party | Candidate | Votes | % | |
|---|---|---|---|---|
| Democratic | Walter E. Fauntroy (inc.) | 93,422 | 83.01 | |
| Republican | John West | 17,242 | 15.32 | |
| No party | Write-ins | 1,879 | 1.67 | |
| Total votes | 112,543 | 100.00 | ||
| Turnout | ||||
| Democratic hold | ||||
| Party | Candidate | Votes | % | |
|---|---|---|---|---|
| Democratic | Walter E. Fauntroy (inc.) | 154,583 | 95.56 | |
| No party | Write-ins | 7,188 | 4.44 | |
| Total votes | 161,771 | 100.00 | ||
| Turnout | ||||
| Democratic hold | ||||
| Party | Candidate | Votes | % | |
|---|---|---|---|---|
| Democratic | Walter E. Fauntroy (inc.) | 101,604 | 80.09 | |
| Republican | Mary L. H. King | 17,643 | 13.91 | |
| D.C. Statehood Green | Julie McCall | 6,122 | 4.83 | |
| No party | Write-ins | 1,486 | 1.17 | |
| Total votes | 126,855 | 100.00 | ||
| Turnout | ||||
| Democratic hold | ||||
| Party | Candidate | Votes | % | |
|---|---|---|---|---|
| Democratic | Walter E. Fauntroy (inc.) | 121,817 | 71.27 | |
| Republican | Ron Evans | 22,936 | 13.42 | |
| D.C. Statehood Green | Alvin C. Frost | 13,802 | 8.07 | |
| Independent | David H. Dabney | 10,449 | 6.11 | |
| No party | Write-ins | 1,929 | 1.13 | |
| Total votes | 170,933 | 100.00 | ||
| Turnout | ||||
| Democratic hold | ||||
1990s
| Party | Candidate | Votes | % | |
|---|---|---|---|---|
| Democratic | Eleanor Holmes Norton | 98,442 | 61.67 | |
| Republican | Harry M. Singleton | 41,999 | 26.31 | |
| Independent | George X. Cure | 8,156 | 5.11 | |
| D.C. Statehood Green | Leon Frederick Hunt | 4,027 | 2.52 | |
| Independent | David H. Dabney | 3,334 | 2.09 | |
| No party | Write-ins | 3,669 | 2.30 | |
| Total votes | 159,627 | 100.00 | ||
| Turnout | ||||
| Democratic hold | ||||
| Party | Candidate | Votes | % | |
|---|---|---|---|---|
| Democratic | Eleanor Holmes Norton (inc.) | 166,808 | 84.78 | |
| Republican | Susan Emerson | 20,108 | 10.22 | |
| D.C. Statehood Green | Susan Griffin | 7,253 | 3.69 | |
| Socialist Workers | Sam Manuel | 1,840 | 0.94 | |
| No party | Write-ins | 745 | 0.38 | |
| Total votes | 196,754 | 100.00 | ||
| Turnout | ||||
| Democratic hold | ||||
| Party | Candidate | Votes | % | |
|---|---|---|---|---|
| Democratic | Eleanor Holmes Norton (inc.) | 154,988 | 89.25 | |
| Republican | Donald A. Saltz | 13,828 | 7.96 | |
| D.C. Statehood Green | Rasco P. Braswell | 2,824 | 1.63 | |
| Socialist Workers | Bradley Downs | 1,476 | 0.85 | |
| No party | Write-ins | 548 | 0.32 | |
| Total votes | 173,664 | 100.00 | ||
| Turnout | ||||
| Democratic hold | ||||
| Party | Candidate | Votes | % | |
|---|---|---|---|---|
| Democratic | Eleanor Holmes Norton (inc.) | 134,996 | 90.00 | |
| Republican | Sprague Simonds | 11,306 | 7.54 | |
| Independent | Faith | 2,119 | 1.41 | |
| Socialist Workers | Sam Manuel | 1,146 | 0.76 | |
| No party | Write-ins | 431 | 0.29 | |
| Total votes | 149,998 | 100.00 | ||
| Turnout | ||||
| Democratic hold | ||||
| Party | Candidate | Votes | % | |
|---|---|---|---|---|
| Democratic | Eleanor Holmes Norton (inc.) | 122,228 | 89.64 | |
| Republican | Edward Henry Wolterbeek | 8,610 | 6.31 | |
| D.C. Statehood Green | Pat Kidd | 2,323 | 1.70 | |
| Independent | Natale "Lino" Stracuzzi | 1,647 | 1.21 | |
| Socialist Workers | Mary Martin | 1,087 | 0.80 | |
| No party | Write-ins | 464 | 0.34 | |
| Total votes | 136,359 | 100.00 | ||
| Turnout | ||||
| Democratic hold | ||||
2000s
| Party | Candidate | Votes | % | |
|---|---|---|---|---|
| Democratic | Eleanor Holmes Norton (inc.) | 158,824 | 90.43 | |
| Republican | Edward Henry Wolterbeek | 10,258 | 5.84 | |
| Libertarian | Robert D. Kampia | 4,594 | 2.62 | |
| Socialist Workers | Sam Manuel | 1,419 | 0.81 | |
| No party | Write-ins | 536 | 0.31 | |
| Total votes | 175,631 | 100.00 | ||
| Turnout | ||||
| Democratic hold | ||||
| Party | Candidate | Votes | % | |
|---|---|---|---|---|
| Democratic | Eleanor Holmes Norton (inc.) | 119,268 | 93.01 | |
| Independent | Pat Kidd | 7,733 | 6.03 | |
| No party | Write-ins | 1,232 | 0.96 | |
| Total votes | 128,233 | 100.00 | ||
| Turnout | ||||
| Democratic hold | ||||
| Party | Candidate | Votes | % | |
|---|---|---|---|---|
| Democratic | Eleanor Holmes Norton (inc.) | 202,027 | 91.33 | |
| Republican | Michael Andrew Monroe | 18,296 | 8.27 | |
| No party | Write-ins | 890 | 0.40 | |
| Total votes | 221,213 | 100.00 | ||
| Turnout | ||||
| Democratic hold | ||||
| Party | Candidate | Votes | % | |
|---|---|---|---|---|
| Democratic | Eleanor Holmes Norton (inc.) | 111,726 | 97.34 | |
| No party | Write-ins | 3,051 | 2.66 | |
| Total votes | 114,777 | 100.00 | ||
| Turnout | ||||
| Democratic hold | ||||
| Party | Candidate | Votes | % | |
|---|---|---|---|---|
| Democratic | Eleanor Holmes Norton (inc.) | 228,376 | 92.28 | |
| D.C. Statehood Green | Maude Hills | 16,693 | 6.75 | |
| No party | Write-ins | 2,402 | 0.97 | |
| Total votes | 247,471 | 100.00 | ||
| Turnout | ||||
| Democratic hold | ||||
2010s
| Party | Candidate | Votes | % | |
|---|---|---|---|---|
| Democratic | Eleanor Holmes Norton (inc.) | 117,990 | 88.94 | |
| Republican | Missy Reilly Smith | 8,109 | 6.11 | |
| D.C. Statehood Green | Rick Tingling-Clemmons | 4,413 | 3.33 | |
| No party | Write-ins | 2,144 | 1.61 | |
| Total votes | 132,656 | 100.00 | ||
| Turnout | ||||
| Democratic hold | ||||
| Party | Candidate | Votes | % | |
|---|---|---|---|---|
| Democratic | Eleanor Holmes Norton (inc.) | 246,664 | 88.54 | |
| Libertarian | Bruce Majors | 16,524 | 5.93 | |
| D.C. Statehood Green | Natale "Lino" Stracuzzi | 13,243 | 4.75 | |
| No party | Write-ins | 2,132 | 0.78 | |
| Total votes | 278,563 | 100.00 | ||
| Turnout | ||||
| Democratic hold | ||||
| Party | Candidate | Votes | % | |
|---|---|---|---|---|
| Democratic | Eleanor Holmes Norton (inc.) | 143,923 | 83.73 | |
| Republican | Nelson F. Rimensnyder | 11,673 | 6.79 | |
| Independent | Timothy J. Krepp | 9,101 | 5.29 | |
| D.C. Statehood Green | Natale "Lino" Stracuzzi | 6,073 | 3.53 | |
| No party | Write-ins | 1,123 | 0.65 | |
| Total votes | 171,893 | 100.00 | ||
| Turnout | ||||
| Democratic hold | ||||
| Party | Candidate | Votes | % | |
|---|---|---|---|---|
| Democratic | Eleanor Holmes Norton (inc.) | 265,178 | 84.84 | |
| Libertarian | Martin Moulton | 18,713 | 5.99 | |
| D.C. Statehood Green | Natale "Lino" Stracuzzi | 14,336 | 4.59 | |
| No party | Write-ins | 2,679 | 0.86 | |
| Total votes | 300,906 | 100.00 | ||
| Turnout | ||||
| Democratic hold | ||||
| Party | Candidate | Votes | % | |
|---|---|---|---|---|
| Democratic | Eleanor Holmes Norton (inc.) | 199,124 | 87.04 | |
| Republican | Nelson F. Rimensnyder | 9,700 | 4.24 | |
| D.C. Statehood Green | Natale "Lino" Stracuzzi | 8,636 | 3.77 | |
| Independent | John Cheeks | 5,509 | 2.41 | |
| Libertarian | Bruce Majors | 4,034 | 1.76 | |
| No party | Write-ins | 1,766 | 0.77 | |
| Total votes | 228,769 | 100.00 | ||
| Turnout | ||||
| Democratic hold | ||||
See also
- District of Columbia voting rights
- District of Columbia statehood movement
- United States congressional delegations from the District of Columbia
- List of United States congressional districts
References
- https://www.census.gov/mycd/?st=11
- "Districts of the 113th Congress: 2004 & 2008" (PDF). Partisan Voting Index. The Cook Political Report. October 11, 2012. Retrieved 2014-02-17.
- Barone, Michael; McCutcheon, Chuck (2013). The Almanac of American Politics 2014. Chicago: University of Chicago Press. pp. 358–. ISBN 978-0-226-10544-4. Copyright National Journal.
- http://www.gpo.gov/fdsys/granule/STATUTE-84/STATUTE-84-Pg845-2/content-detail.html
- "Fauntroy Election Certified". The Washington Post. April 6, 1971. p. C6. Retrieved February 10, 2014.
- The practice began with the 103rd Congress, but was revoked when the Republicans retook the House for the 104th Congress. Democrats reinstated the practice in the 110th Congress, but Republicans again revoked it in the 112th Congress.
- Portnoy, Jenna (January 3, 2017). "Republican-led Congress denies D.C. delegate a vote. Again". The Washington Post. Washington, D.C. Retrieved December 17, 2018.
- Gibbs, C. R. (March 2, 1989). "The District Had a Voice, if Not a Vote, in the 42nd Congress". The Washington Post. p. DC3.
- "The Washington Election". The Baltimore Sun. Apr 20, 1871. p. 1.
- Gibbs, C. R. (March 2, 1989). "The District Had a Voice, if Not a Vote, in the 42nd Congress". The Washington Post. p. DC3.
- "Fauntroy Election Certified". The Washington Post. April 6, 1971. p. C6.
- "General Election 2016 - Certified Results". District of Columbia Board of Elections. Retrieved December 14, 2016.
- "General Election 2018 — Certified Results". District of Columbia Board of Elections. Retrieved December 17, 2018.
External links
| Topics | ||
|---|---|---|
| Government | ||
| Services | ||
| Society | ||
| History |
| |