Alabama's 6th congressional district
Alabama's 6th congressional district is a United States congressional district in Alabama that elects a representative to the United States House of Representatives. It is composed of the wealthier portions of Birmingham, nearly all of Jefferson County outside Birmingham, and the entirety of Bibb, Blount, Chilton, Coosa, and Shelby counties.
| Alabama's 6th congressional district | |||
|---|---|---|---|
.tif.png) Alabama's 6th congressional district - since January 3, 2013. | |||
| Representative |
| ||
| Area | 4,649 sq mi (12,040 km2) | ||
| Distribution |
| ||
| Population (2016) | 706,308[2] | ||
| Median income | $65,170[3] | ||
| Ethnicity |
| ||
| Occupation |
| ||
| Cook PVI | R+26[4] | ||
It is currently represented by Republican Gary Palmer.
Character
Once encompassing all of Birmingham and Jefferson County, Alabama's 6th congressional district is now the suburban Birmingham-area district, with nearly all of the urban precincts having been removed since 1992. Due to a continual process of redistricting by Republican state governments since the late 1990s, the 6th district has taken on an increasingly unusual shape (typical of gerrymandered districts) and become one of the most Republican districts in the country. In 2004 it voted 78% for Republican George W. Bush in the presidential election (in keeping with the current proportion of white majority of its population). John McCain swept the district in 2008, taking 75.91% of the vote while Barack Obama received 23.28%.
The demography of the district consists mostly of middle and upper middle-class white-collar white families whose adults work in Birmingham. Increasingly, the population of the Birmingham districts has become racially and politically polarized. Since the 1990s, most wealthier whites moved from the city to the suburbs, settling in newer housing in nearby Shelby County. The African American population of the region has remained largely in more urban areas, even as the upper-class live in income-related neighborhoods.
Birmingham was once the vanguard district for steel production and metalworking in the South, but restructuring of heavy industries hollowed out the economy of the city, taking many jobs with it. The economy of the 6th district since the late 20th century has centered on the banking industry (Birmingham is the second-largest banking area in the South) and health care/medical research. Voters are socially conservative; however, fiscal conservatism is the most salient feature of this district.
History
Alabama's 6th congressional district was originally created in 1843. It encompassed the northeastern portion of Alabama, approximately the modern counties of DeKalb, Jackson, Madison, Marshall, Etowah, St. Clair, Blount and Cullman.
The district had a population of 66,111 as of the 1840 U.S. Census, which made it the second least populous district in Alabama.[5] Neither Cullman County nor Etowah County existed at the time, so only the eastern portion of what today is Cullman County was in the district. In the case of St. Clair County, it appears that only about half of St. Clair County in 1843 was in the district.
The district was redrawn in 1855. This was done in time for the election of representatives to the 34th Congress which was held August 6, 1855. The new boundaries put Cherokee County in the 6th district and removed St. Clair County. These boundaries remained in place until the Civil War.
When Alabama again elected representatives to the U.S. Congress in 1868 for the halfway completed 40th Congress, the 6th district consisted of northwestern Alabama. The only county remaining in the district from before was Blount County. It also encompassed Jefferson, Marion, Walker, Morgan, Limestone, Franklin, Lauderdale and Winston counties. Colbert County did not exist at the time, but was part of Franklin County. This was one of the areas of Alabama where the Democrats soonest regained control after the Civil War.
In 1876, the 6th district was redrawn again. The sixth-most northern counties (including Colbert County which now existed) were transferred to the new Alabama 8th Congressional district, while the six counties southwestward from Jefferson County were transferred to the 6th district.
This set of boundaries only existed for one election. By the time of the 1878 election, Cullman County had been formed. It was in the 6th district, but Blount County was moved to the 8th district. The boundaries did not exactly correspond to county lines at that time, and with another change in county boundaries by 1880 even more area in the general vicinity of Blount County was moved to the 7th district. This process was continued in 1884 with the removal of Cullman County from the district.
The year of 1892 saw more changes in the boundaries of the 6th district. Winston County was moved to the 7th district. At the same time Jefferson County was placed in the new 9th district. By this time the 6th district consisted of west central Alabama. In the 1892 election there were about 22,000 votes cast in the 6th district as opposed to 30,000 cast in the 9th district.[6]
In 1902, Perry County and some other areas in the southern portion of Alabama's 9th Congressional district were transferred to the 6th district. The state legislature did not redistrict for several decades, resulting in urban and industrial areas being under-represented in congressional and state districts. It was forced to redistrict after a 1972 Supreme Court case based on the principle of one man-one vote.
Recent results in statewide elections
| Year | Office | Results |
| 2000 | President | Bush 74 - 25% |
| 2004 | President | Bush 78 - 22% |
| 2008 | President | McCain 76 - 23% |
| 2012 | President | Romney 74 - 25% |
| 2016 | President | Trump 71 - 26% |
List of members representing the district
| Member | Party | Years | Cong ress |
Electoral history |
|---|---|---|---|---|
| District created March 4, 1843 | ||||
 Reuben Chapman |
Democratic | March 4, 1843 – March 3, 1847 |
28th 29th |
Redistricted from the at-large district. Re-elected in 1843. Re-elected in 1845. [data unknown/missing] |
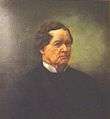
 Williamson Robert Winfield Cobb |
Democratic | March 4, 1847 – January 30, 1861 |
30th 31st 32nd 33rd 34th 35th 36th |
Elected in 1847. Re-elected in 1849. Re-elected in 1851. Re-elected in 1853. Re-elected in 1855. Re-elected in 1857. Re-elected in 1859. Withdrew. |
| Vacant | January 30, 1861 – July 21, 1868 |
36th 37th 38th 39th 40th |
Civil War and Reconstruction | |
 Thomas Haughey |
Republican | July 21, 1868 – March 3, 1869 |
40th | Elected to finish the partial term. [data unknown/missing] |
 William Crawford Sherrod |
Democratic | March 4, 1869 – March 3, 1871 |
41st | Elected in 1869. [data unknown/missing] |
| Joseph Humphrey Sloss | Democratic | March 4, 1871 – March 3, 1875 |
42nd 43rd |
Elected in 1870. Re-elected in 1872. [data unknown/missing] |
 Goldsmith W. Hewitt |
Democratic | March 4, 1875 – March 3, 1879 |
44th 45th |
Elected in 1874. Re-elected in 1876. [data unknown/missing] |
| Burwell Boykin Lewis | Democratic | March 4, 1879 – October 1, 1880 |
46th | Elected in 1878. Resigned to become President of the University of Alabama. |
| Vacant | October 1, 1880 – December 8, 1880 | |||
| Newton Nash Clements | Democratic | December 8, 1880 – March 3, 1881 |
46th | Elected to finish Lewis's term. Had not been a candidate for the next term. |
Goldsmith W. Hewitt |
Democratic | March 4, 1881 – March 3, 1885 |
47th 48th |
Elected in 1880. Re-elected in 1882. [data unknown/missing] |
| John Mason Martin | Democratic | March 4, 1885 – March 3, 1887 |
49th | Elected in 1884. [data unknown/missing] |
 John H. Bankhead |
Democratic | March 4, 1887 – March 3, 1907 |
50th 51st 52nd 53rd 54th 55th 56th 57th 58th 59th |
Elected in 1886. Re-elected in 1888. Re-elected in 1890. Re-elected in 1892. Re-elected in 1894. Re-elected in 1896. Re-elected in 1898. Re-elected in 1900. Re-elected in 1902. Re-elected in 1904. [data unknown/missing] |
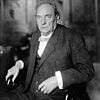
 Richmond P. Hobson |
Democratic | March 4, 1907 – March 3, 1915 |
60th 61st 62nd 63rd |
Elected in 1906. Re-elected in 1908. Re-elected in 1910. Re-elected in 1912. [data unknown/missing] |
 William B. Oliver |
Democratic | March 4, 1915 – January 3, 1937 |
64th 65th 66th 67th 68th 69th 70th 71st 72nd 73rd 74th |
Elected in 1914. Re-elected in 1916. Re-elected in 1918. Re-elected in 1920. Re-elected in 1922. Re-elected in 1924. Re-elected in 1926. Re-elected in 1928. Re-elected in 1930. Re-elected in 1932. Re-elected in 1934. [data unknown/missing] |
 Pete Jarman |
Democratic | January 3, 1937 – January 3, 1949 |
75th 76th 77th 78th 79th 80th |
Elected in 1936. Re-elected in 1938. Re-elected in 1940. Re-elected in 1942. Re-elected in 1944. Re-elected in 1946. [data unknown/missing] |
 Edward deGraffenried |
Democratic | January 3, 1949 – January 3, 1953 |
81st 82nd |
Elected in 1948. Re-elected in 1950. [data unknown/missing] |
 Armistead I. Selden Jr. |
Democratic | January 3, 1953 – January 3, 1963 |
83rd 84th 85th 86th 87th |
Elected in 1952. Re-elected in 1954. Re-elected in 1956. Re-elected in 1958. Re-elected in 1960. Redistricted to the at-large district. |
| District inactive | January 3, 1963 – January 3, 1965 |
88th | All representatives elected at-large on a general ticket. | |
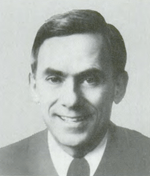
 John H. Buchanan Jr. |
Republican | January 3, 1965 – January 3, 1981 |
89th 90th 91st 92nd 93rd 94th 95th 96th |
Elected in 1964. Re-elected in 1966. Re-elected in 1968. Re-elected in 1970. Re-elected in 1972. Re-elected in 1974. Re-elected in 1976. Re-elected in 1978. [data unknown/missing] |
 Albert L. Smith Jr. |
Republican | January 3, 1981 – January 3, 1983 |
97th | Elected in 1980. [data unknown/missing] |
 Ben Erdreich |
Democratic | January 3, 1983 – January 3, 1993 |
98th 99th 100th 101st 102nd |
Elected in 1982. Re-elected in 1984. Re-elected in 1986. Re-elected in 1988. Re-elected in 1990. [data unknown/missing] |
 Spencer Bachus |
Republican | January 3, 1993 – January 3, 2015 |
103rd 104th 105th 106th 107th 108th 109th 110th 111th 112th 113th |
Elected in 1992. Re-elected in 1994. Re-elected in 1996. Re-elected in 1998. Re-elected in 2000. Re-elected in 2002. Re-elected in 2004. Re-elected in 2006. Re-elected in 2008. Re-elected in 2010. Re-elected in 2012. Retired. |
 Gary Palmer |
Republican | January 3, 2015 – present |
114th 115th 116th |
Elected in 2014. Re-elected in 2016. Re-elected in 2018. |
Recent election results
2002
| Party | Candidate | Votes | % | ± | |
|---|---|---|---|---|---|
| Republican | Spencer T. Bachus III (Incumbent) | 178,171 | 90% | ||
| Libertarian | J. Holden McAllister | 19,639 | 10 | ||
| Write-in | Write-ins | 536 | 0.27 | ||
| Majority | 158,532 | 80 | |||
| Total votes | 198,346 | 100 | |||
| Republican hold | |||||
2004
| Party | Candidate | Votes | % | ± | |
|---|---|---|---|---|---|
| Republican | Spencer T. Bachus III (Incumbent) | 264,819 | 99% | ||
| Write-in | Write-ins | 3,224 | 1 | ||
| Majority | 261,595 | 98 | |||
| Total votes | 268,043 | 100 | |||
| Republican hold | |||||
2006
| Party | Candidate | Votes | % | ± | |
|---|---|---|---|---|---|
| Republican | Spencer T. Bachus III (Incumbent) | 163,514 | 98% | ||
| Write-in | Write-ins | 2,786 | 2 | ||
| Majority | 160,728 | 96 | |||
| Total votes | 166,300 | 100 | |||
| Republican hold | |||||
2008
| Party | Candidate | Votes | % | ± | |
|---|---|---|---|---|---|
| Republican | Spencer T. Bachus III (Incumbent) | 280,902 | 98% | ||
| Write-in | Write-ins | 6,335 | 2 | ||
| Majority | 274,567 | 96 | |||
| Total votes | 287,237 | 100 | |||
| Republican hold | |||||
2010
| Party | Candidate | Votes | % | ± | |
|---|---|---|---|---|---|
| Republican | Spencer T. Bachus III (Incumbent) | 205,288 | 100% | ||
| Majority | 205,288 | 100 | |||
| Total votes | 205,288 | 100 | |||
| Republican hold | |||||
2012
| Party | Candidate | Votes | % | ± | |
|---|---|---|---|---|---|
| Republican | Spencer T. Bachus III (Incumbent) | 219,016 | 71% | ||
| Democratic | Penny Bailey | 88,102 | 29 | ||
| Majority | 130,914 | 42 | |||
| Total votes | 307,118 | 100 | |||
| Republican hold | |||||
2014
| Party | Candidate | Votes | % | ± | |
|---|---|---|---|---|---|
| Republican | Gary Palmer | 135,935 | 76% | ||
| Democratic | Mark Lester | 42,291 | 24 | ||
| Majority | 93,754 | 52 | |||
| Total votes | 178,449 | 100 | |||
| Republican hold | |||||
2016
| Party | Candidate | Votes | % | |
|---|---|---|---|---|
| Republican | Gary Palmer (Incumbent) | 245,313 | 74.96 | |
| Democratic | David Putnam | 83,709 | 24.95 | |
| No party | Write-ins | 284 | 0.09 | |
| Total votes | 329,306 | 100.00 | ||
| Turnout | ||||
| Republican hold | ||||
2018
| Party | Candidate | Votes | % | ± | |
|---|---|---|---|---|---|
| Republican | Gary Palmer (Incumbent) | 192,542 | 69% | ||
| Democratic | Danner Kline | 85,644 | 31 | ||
| Majority | 106,898 | 38 | |||
| Total votes | 278,186 | 100 | |||
| Republican hold | |||||
Historical district boundaries

References
- Geography, US Census Bureau. "Congressional Districts Relationship Files (state-based)". www.census.gov.
- Bureau, Center for New Media & Promotion (CNMP), US Census. "My Congressional District". www.census.gov.
- "My Congressional District".
- "Partisan Voting Index – Districts of the 115th Congress" (PDF). The Cook Political Report. April 7, 2017. Retrieved April 7, 2017.
- Parson, Stanley B., William W. Beach and Michael J. Durbin. United States Congressional Districts and Data, 1843-1883 (Westport: Greenwood Press, 1986) p. 1
- United States Congressional Elections. Michael J. Dubin. p. 295
- Martis, Kenneth C. (1989). The Historical Atlas of Political Parties in the United States Congress. New York: Macmillan Publishing Company.
- Martis, Kenneth C. (1982). The Historical Atlas of United States Congressional Districts. New York: Macmillan Publishing Company.
- Congressional Biographical Directory of the United States 1774–present