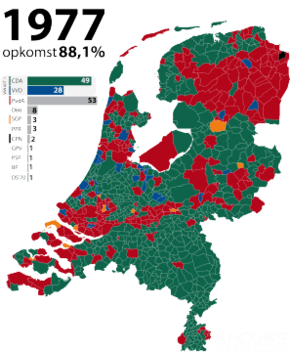
1977 Dutch general election
General elections were held in the Netherlands on 25 May 1977.[1] The Labour Party remained the largest party, winning 53 of the 150 seats in the House of Representatives.[2] Following the election, it took 208 days of negotiations to form a new government. This was a European record for longest government formation that stood until after the 2010 Belgian general election.[3] The Christian Democratic Appeal was formed by the Anti-Revolutionary Party (ARP), Christian Historical Union (CHU) and the Catholic People's Party (KVP) in 1976. The first joint party leader was a member of the KVP, Dries van Agt.
| |||||||||||||||||||||||||||||||||||||||||||||||||||||||||||||
| Turnout | 88.1% | ||||||||||||||||||||||||||||||||||||||||||||||||||||||||||||
|---|---|---|---|---|---|---|---|---|---|---|---|---|---|---|---|---|---|---|---|---|---|---|---|---|---|---|---|---|---|---|---|---|---|---|---|---|---|---|---|---|---|---|---|---|---|---|---|---|---|---|---|---|---|---|---|---|---|---|---|---|---|
This lists parties that won seats. See the complete results below. | |||||||||||||||||||||||||||||||||||||||||||||||||||||||||||||
 | |||||||||||||||||||||||||||||||||||||||||||||||||||||||||||||
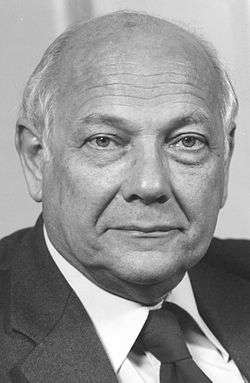

Eventually a coalition was formed between the Christian Democratic Appeal and the People's Party for Freedom and Democracy with Dries van Agt as Prime Minister.
Results
| Party | Votes | % | Seats | +/– |
|---|---|---|---|---|
| Labour Party | 2,813,793 | 33.8 | 53 | +10 |
| Christian Democratic Appeal | 2.653.416 | 31.9 | 49 | +1 |
| People's Party for Freedom and Democracy | 1,492,689 | 17.9 | 28 | +6 |
| Democrats 1966 | 452,423 | 5.4 | 8 | +2 |
| Reformed Political Party | 177,010 | 2.1 | 3 | 0 |
| Communist Party of the Netherlands | 143,481 | 1.7 | 2 | –5 |
| Political Party of Radicals | 140,910 | 1.7 | 3 | –4 |
| Reformed Political League | 79,421 | 1.0 | 1 | –1 |
| Pacifist Socialist Party | 77,972 | 0.9 | 1 | –1 |
| Farmers' Party | 69,914 | 0.8 | 1 | –2 |
| Democratic Socialists '70 | 59,487 | 0.7 | 1 | –5 |
| Reformatory Political Federation | 53,220 | 0.6 | 0 | New |
| Dutch Peoples-Union | 33,434 | 0.4 | 0 | New |
| Roman Catholic Party of the Netherlands | 33,227 | 0.4 | 0 | –1 |
| Socialist Party | 24,420 | 0.3 | 0 | New |
| Federation of Elderly Parties of the Netherlands | 4,379 | 0.1 | 0 | New |
| Verbond tegen Ambtelijke Willekeur | 4,110 | 0.0 | 0 | New |
| Communist Unity Movement of the Netherlands | 2,649 | 0.0 | 0 | New |
| Democratic Action Centre | 2,150 | 0.0 | 0 | New |
| Party of the Taxpayers | 201 | 0.0 | 0 | New |
| European Conservative Union | 197 | 0.0 | 0 | New |
| Jusia List | 91 | 0.0 | 0 | New |
| Dutch Middle Class Party | 89 | 0.0 | 0 | 0 |
| Griek List | 67 | 0.0 | 0 | New |
| Invalid/blank votes | 48,217 | – | – | – |
| Total | 8,365,829 | 100 | 150 | 0 |
| Registered voters/turnout | 9,506,318 | 88.0 | – | – |
| Source: Nederlandse verkiezingsuitslagen | ||||
References
- Dieter Nohlen & Philip Stöver (2010) Elections in Europe: A data handbook, p1396 ISBN 978-3-8329-5609-7
- Nohlen & Stöver, p1414
- Laurent Thomet (January 8, 2011). "Belgium's shoddy political record poses financial threat". Retrieved 2011-01-27.
Without a government for nearly seven months, Belgium now holds a dubious record in Europe and with no end in sight to the political crisis, fears are growing of a backlash from watchful markets. The divided country on Saturday broke the 208-day mark set by the Netherlands in 1977 for being without a government.
| General elections |
|
|---|---|
| Provincial elections | |
| Municipal elections | |
| European elections | |
| Water board elections |
|
| Referendums | |
| |