1933 Dutch general election
General elections were held in the Netherlands on 26 April 1933.[1] The Roman Catholic State Party remained the largest party in the House of Representatives, winning 28 of the 100 seats.[2]
| ||||||||||||||||||||||||||||||||||||||||||||||||||||||||||||||||||||||||||||
| Turnout | 94.5% | |||||||||||||||||||||||||||||||||||||||||||||||||||||||||||||||||||||||||||
|---|---|---|---|---|---|---|---|---|---|---|---|---|---|---|---|---|---|---|---|---|---|---|---|---|---|---|---|---|---|---|---|---|---|---|---|---|---|---|---|---|---|---|---|---|---|---|---|---|---|---|---|---|---|---|---|---|---|---|---|---|---|---|---|---|---|---|---|---|---|---|---|---|---|---|---|---|
This lists parties that won seats. See the complete results below. | ||||||||||||||||||||||||||||||||||||||||||||||||||||||||||||||||||||||||||||
| ||||||||||||||||||||||||||||||||||||||||||||||||||||||||||||||||||||||||||||


 |
|---|
| This article is part of a series on the politics and government of Netherlands |
|
|
Local government
|
|
Related topics |
Results
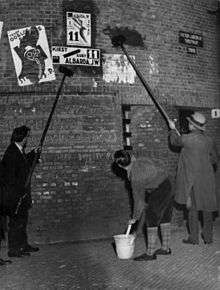
Men putting up election posters
| Party | Votes | % | Seats | +/– |
|---|---|---|---|---|
| Roman Catholic State Party | 1,037,364 | 27.9 | 28 | –2 |
| Social Democratic Workers' Party | 798,632 | 21.5 | 22 | –2 |
| Anti-Revolutionary Party | 499,892 | 13.4 | 14 | +2 |
| Christian Historical Union | 339,809 | 9.1 | 10 | –1 |
| Liberal State Party | 258,732 | 7.0 | 7 | –1 |
| Free-thinking Democratic League | 188,952 | 5.1 | 6 | –1 |
| Communist Party Holland | 118,238 | 3.2 | 4 | +2 |
| Reformed Political Party | 93,274 | 2.5 | 3 | 0 |
| Revolutionary Socialist Party | 48,405 | 1.3 | 1 | +1 |
| National Farmers', Horticulturists' and Middle Class Party | 47,688 | 1.3 | 1 | 0 |
| Roman Catholic People's Party | 40,904 | 1.1 | 1 | +1 |
| Christian Democratic Union | 38,464 | 1.0 | 1 | +1 |
| Hervormd Gereformeerde Staatspartij | 33,930 | 0.9 | 1 | 0 |
| Alliance for National Reconstruction | 30,332 | 0.8 | 1 | New |
| General Workers' League | 147,212 | 4.0 | 0 | New |
| General Democratic Union | 0 | New | ||
| General Dutch Fascist League | 0 | New | ||
| General Welfare Party | 0 | 0 | ||
| General Dutch Tenants' League | 0 | New | ||
| Anti-Crisis Party | 0 | New | ||
| Central Democratic Labour Party | 0 | New | ||
| Christian Workers Party | 0 | 0 | ||
| Handeldrijvende Middenstand | 0 | New | ||
| Main and Manual Workers | 0 | 0 | ||
| Catholic Democratic League | 0 | New | ||
| Bongers List | 0 | New | ||
| De Wit List | 0 | New | ||
| Eijking List | 0 | New | ||
| Engels List | 0 | New | ||
| Groothuis List | 0 | New | ||
| Jacobs List | 0 | New | ||
| Triesscheijn List | 0 | New | ||
| Wolswinkel List | 0 | New | ||
| Limburg Federation | 0 | New | ||
| Market Traders | 0 | New | ||
| National Socialist Party | 0 | New | ||
| Nationaal Verbond Plicht, Orde, Recht | 0 | New | ||
| National Union of Labour Interest | 0 | New | ||
| National Workmen's Party | 0 | New | ||
| Dutch League of Taxpayers | 0 | New | ||
| Dutch Fascist Union | 0 | New | ||
| New Socialist Party | 0 | New | ||
| Independent Socialist Party | 0 | New | ||
| Independent Businessmen | 0 | New | ||
| Building and Reconciliation | 0 | New | ||
| Orange Fascists | 0 | New | ||
| Proletarian Group | 0 | New | ||
| Justice and Freedom | 0 | New | ||
| RK Bouwvakarbeiders | 0 | New | ||
| Roman Catholic Labour Party | 0 | New | ||
| Universal Party | 0 | New | ||
| Union of Nationalists | 0 | 0 | ||
| For General Welfare | 0 | New | ||
| Zuiderzee Party | 0 | New | ||
| Invalid/blank votes | 177,827 | – | – | – |
| Total | 3,899,655 | 100 | 100 | 0 |
| Registered voters/turnout | 4,126,490 | 94.5 | – | – |
| Source: Nohlen & Stöver | ||||
References
- Dieter Nohlen & Philip Stöver (2010) Elections in Europe: A data handbook, p1395 ISBN 978-3-8329-5609-7
- Nohlen & Stöver, p1412
| General elections |
|
|---|---|
| Provincial elections | |
| Municipal elections | |
| European elections | |
| Water board elections |
|
| Referendums | |
| |
This article is issued from Wikipedia. The text is licensed under Creative Commons - Attribution - Sharealike. Additional terms may apply for the media files.