1971 Dutch general election
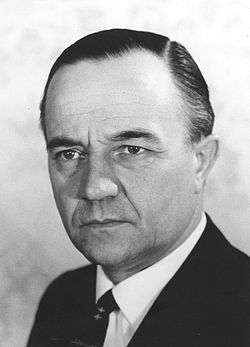
General elections were held in the Netherlands on 28 April 1971.[1] The Labour Party (PvdA) emerged as the largest party, winning 39 of the 150 seats in the House of Representatives.[2] The elections were the first without compulsory voting, causing a sharp fall in voter turnout, down to 79.1% from 94.9% in the 1967 elections.[3] Barend Biesheuvel of the Anti-Revolutionary Party (ARP) became Prime Minister, leading the first Biesheuvel cabinet.
| ||||||||||||||||||||||||||||||||||||||||||||||||||||||||||||||||||||||||||||
| Turnout | 79.1% | |||||||||||||||||||||||||||||||||||||||||||||||||||||||||||||||||||||||||||
|---|---|---|---|---|---|---|---|---|---|---|---|---|---|---|---|---|---|---|---|---|---|---|---|---|---|---|---|---|---|---|---|---|---|---|---|---|---|---|---|---|---|---|---|---|---|---|---|---|---|---|---|---|---|---|---|---|---|---|---|---|---|---|---|---|---|---|---|---|---|---|---|---|---|---|---|---|
This lists parties that won seats. See the complete results below. | ||||||||||||||||||||||||||||||||||||||||||||||||||||||||||||||||||||||||||||
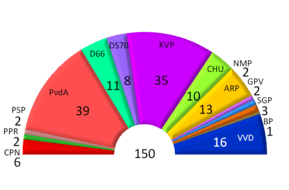 Seats | ||||||||||||||||||||||||||||||||||||||||||||||||||||||||||||||||||||||||||||
| ||||||||||||||||||||||||||||||||||||||||||||||||||||||||||||||||||||||||||||
.jpg)
His cabinet contained a broad coalition of parties, with ministers from ARP, Christian Historical Union (both Protestant), the Catholic People's Party, the conservative-liberal People's Party for Freedom and Democracy and moderate socialist Democratic Socialists '70 (DS'70), which had just split off from the PvdA.
However, Biesheuvel's government was short-lived; following a decision to cut government spending, DS'70 withdrew from the government, causing it to lose its majority and fresh elections to be held after just a year and seven months.
Results
| Party | Votes | % | Seats | +/– |
|---|---|---|---|---|
| Labour Party | 1,554,280 | 24.6 | 39 | +2 |
| Catholic People's Party | 1,379,672 | 21.8 | 35 | –7 |
| People's Party for Freedom and Democracy | 653,370 | 10.3 | 16 | –1 |
| Anti-Revolutionary Party | 542,742 | 8.6 | 13 | –2 |
| Democrats 1966 | 428,067 | 6.8 | 11 | +4 |
| Christian Historical Union | 399,106 | 6.3 | 10 | –2 |
| Democratic Socialists '70 | 336,714 | 5.3 | 8 | New |
| Communist Party of the Netherlands | 246,569 | 3.9 | 6 | +1 |
| Reformed Political Party | 148,192 | 2.3 | 3 | 0 |
| Political Party of Radicals | 116,049 | 1.8 | 2 | New |
| Reformed Political League | 101,790 | 1.6 | 2 | +1 |
| New Middle Party | 95,706 | 1.5 | 2 | New |
| Pacifist Socialist Party | 90,738 | 1.4 | 2 | –2 |
| Farmers' Party | 69,656 | 1.1 | 1 | –6 |
| General Elderly Party of the Netherlands | 26,878 | 0.4 | 0 | New |
| Dutch Appeal | 24,376 | 0.4 | 0 | New |
| New Roman-Catholic Party | 23,047 | 0.4 | 0 | New |
| Kabouters | 21,982 | 0.3 | 0 | New |
| Elderly and Labour Party | 21,488 | 0.3 | 0 | New |
| Binding Right | 15,137 | 0.2 | 0 | New |
| Democrats 2000 | 7,189 | 0.1 | 0 | New |
| Elderly Party 65+ | 5,739 | 0.1 | 0 | New |
| Van Velsen List | 3,676 | 0.1 | 0 | New |
| Elderly Party General Interest | 1,840 | 0.0 | 0 | New |
| Stichting Gedupeerde Groepen 18+ t/m 65+ | 1,647 | 0.0 | 0 | New |
| Rural Party for the Elderly | 1,620 | 0.0 | 0 | New |
| Party of the Right | 477 | 0.0 | 0 | 0 |
| Positive Social Democrats | 400 | 0.0 | 0 | New |
| Invalid/blank votes | 46,567 | – | – | – |
| Total | 6,364,719 | 100 | 150 | 0 |
| Registered voters/turnout | 8,048,726 | 79.1 | – | – |
| Source: Nederlandse verkiezingsuitslagen | ||||
References
- http://www.parlement.com/id/vh8lnhronvwt/tweede_kamerverkiezingen_1971
- Nohlen & Stöver, p1414
- Nohlen & Stöver, p1397
| General elections |
|
|---|---|
| Provincial elections | |
| Municipal elections | |
| European elections | |
| Water board elections |
|
| Referendums | |
| |