1925 Dutch general election
General elections were held in the Netherlands on 1 July 1925.[1] The General League of Roman Catholic Caucuses remained the largest party in the House of Representatives, winning 30 of the 100 seats.[2]
| |||||||||||||||||||||||||||||||||||||||||||||||||||||||||||||
| Turnout | 91.4% | ||||||||||||||||||||||||||||||||||||||||||||||||||||||||||||
|---|---|---|---|---|---|---|---|---|---|---|---|---|---|---|---|---|---|---|---|---|---|---|---|---|---|---|---|---|---|---|---|---|---|---|---|---|---|---|---|---|---|---|---|---|---|---|---|---|---|---|---|---|---|---|---|---|---|---|---|---|---|
This lists parties that won seats. See the complete results below. | |||||||||||||||||||||||||||||||||||||||||||||||||||||||||||||
| |||||||||||||||||||||||||||||||||||||||||||||||||||||||||||||


 |
|---|
| This article is part of a series on the politics and government of Netherlands |
|
|
Local government
|
|
Related topics |
Results
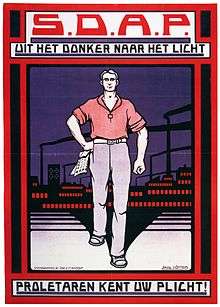
A 1925 SDAP election poster
| Party | Votes | % | Seats | +/– |
|---|---|---|---|---|
| General League of Roman Catholic Caucuses | 883,333 | 28.6 | 30 | –2 |
| Social Democratic Workers' Party | 706,689 | 22.9 | 24 | +4 |
| Anti-Revolutionary Party | 377,426 | 12.2 | 13 | –3 |
| Christian Historical Union | 305,587 | 9.9 | 11 | 0 |
| Liberal State Party | 269,564 | 8.7 | 9 | –1 |
| Free-thinking Democratic League | 187,183 | 6.1 | 7 | +2 |
| Farmers' League Left | 62,639 | 2.0 | 1 | –1 |
| Reformed Political Party | 62,513 | 2.0 | 2 | +1 |
| Communist Party Holland | 36,770 | 1.2 | 1 | –1 |
| Roman Catholic People's Party | 36,571 | 1.2 | 1 | New |
| Hervormd Gereformeerde Staatspartij | 30,258 | 1.0 | 1 | +1 |
| Union of Actualists | 127,329 | 4.1 | 0 | New |
| Austerity League | 0 | 0 | ||
| Christian Democratic Union | 0 | 0 | ||
| Democratic Party | 0 | 0 | ||
| Land Party | 0 | 0 | ||
| Agriculture Party | 0 | New | ||
| Middle Class Party | 0 | New | ||
| New National Party | 0 | New | ||
| Party for Pension Interests | 0 | 0 | ||
| Contributory State Pension | 0 | New | ||
| Protestant People's Party | 0 | 0 | ||
| Rapaille Partij | 0 | 0 | ||
| Rentetrekkers | 0 | New | ||
| Revolutionary Work Committee | 0 | New | ||
| Socialist Party | 0 | 0 | ||
| Sport Party | 0 | New | ||
| Patriotic Party | 0 | New | ||
| Free Thinkers | 0 | New | ||
| Free-thinkers Christian Party | 0 | New | ||
| Wild Party | 0 | New | ||
| Invalid/blank votes | 150,729 | – | – | – |
| Total | 3,236,591 | 100 | 100 | 0 |
| Registered voters/turnout | 3,543,058 | 91.4 | – | – |
| Source: Nohlen & Stöver | ||||
References
- Dieter Nohlen & Philip Stöver (2010) Elections in Europe: A data handbook, p1395 ISBN 978-3-8329-5609-7
- Nohlen & Stöver, p1412
| General elections |
|
|---|---|
| Provincial elections | |
| Municipal elections | |
| European elections | |
| Water board elections |
|
| Referendums | |
| |
This article is issued from Wikipedia. The text is licensed under Creative Commons - Attribution - Sharealike. Additional terms may apply for the media files.