1854 and 1855 United States House of Representatives elections
Elections to the United States House of Representatives for the 34th Congress were held during President Franklin Pierce's term at various dates in different states from August 1854 to November 1855.
| |||||||||||||||||||||||||||||||||||||||||||||||||||||||||||||||||||||||||||||||||||||||||||||||||||||||||
All 234 seats in the U.S. House of Representatives[1] 118 seats needed for a majority | |||||||||||||||||||||||||||||||||||||||||||||||||||||||||||||||||||||||||||||||||||||||||||||||||||||||||
|---|---|---|---|---|---|---|---|---|---|---|---|---|---|---|---|---|---|---|---|---|---|---|---|---|---|---|---|---|---|---|---|---|---|---|---|---|---|---|---|---|---|---|---|---|---|---|---|---|---|---|---|---|---|---|---|---|---|---|---|---|---|---|---|---|---|---|---|---|---|---|---|---|---|---|---|---|---|---|---|---|---|---|---|---|---|---|---|---|---|---|---|---|---|---|---|---|---|---|---|---|---|---|---|---|---|
| |||||||||||||||||||||||||||||||||||||||||||||||||||||||||||||||||||||||||||||||||||||||||||||||||||||||||
| |||||||||||||||||||||||||||||||||||||||||||||||||||||||||||||||||||||||||||||||||||||||||||||||||||||||||
This midterm election was among the most disruptive in American history, auguring the collapse of the Second Party System. Both major parties, the Democratic Party and the Whig Party, organized as rivals for roughly 20 years, lost critical voter support. The Whig Party disintegrated over the slavery issue even as Northern voters, strongly opposing the Kansas–Nebraska Act, shifted sharply against Democrats. The elected majority temporarily coalesced as the Opposition Party. This transitional party included Whigs, Free Soil members, American Party members or Know Nothings, the People's Party of Indiana, Anti-Nebraska candidates, a few disaffected Northern Democrats, and members of the nascent Republican Party, which soon would amalgamate most of these factions, becoming the new rival to the Democrats.
Candidates opposed to the Democratic Party won widely in the North through November 1854. The American Party, ignoring slavery and opposing immigration particularly by Catholics from Ireland and Germany, won seats from both major parties, but to the net loss of Democrats, in New England and the South from November 1854 into 1855.
Congress had passed the Kansas–Nebraska Act in May 1854 after aggressive sponsorship by the Pierce Administration and Democrats led by Illinois Senator Stephen Douglas, including an outspoken contingent of radical pro-slavery legislators. The Act repealed the 1820 Missouri Compromise and triggered the Bleeding Kansas conflict. With widely foreseen risks and immediately negative results, the Act publicly discredited the Democratic Party, fueling new partisan and sectional rancor. It created violent uncertainty on the frontier by abruptly making slavery potentially legal in territories originally comprising the northern portion of the Louisiana Purchase and attractive to contemporary settlers. Settlers were expected to determine the status of slavery locally. This idea appealed to Democratic politicians and to some voters in its shape and intent, but proved unworkable in Kansas where the status of slavery would be closely disputed between more numerous settlers from the North and geographically closer settlers from the South. Even some pro-slavery voters, particularly Southern Whigs, felt repealing the Missouri Compromise was politically reckless and attempting to push slavery by law and force into territories where most settlers predictably were unlikely to want it endangered its continued legal protection anywhere, even in the South. These fears proved prescient.
The election of the Speaker was the lengthiest and most contentious in history. More than 21 Representatives sought the post. After two months and 133 ballots, American Party Representative Nathaniel Banks of Massachusetts, also a Free Soiler, defeated Democrat William Aiken of South Carolina both by plurality and a margin of three votes.[5]
Election summaries
 | |||||||||
| State | Type | Date | Total seats |
Opposition | Democratic | Know Nothing | |||
|---|---|---|---|---|---|---|---|---|---|
| Seats | Change[lower-alpha 7] | Seats | Change | Seats | Change | ||||
| Arkansas | District | August 4, 1854 | 2 | 0 | 2 | 0 | |||
| Iowa | District | August 7, 1854 | 2 | 1 | 1 | 0 | |||
| Missouri | District | August 7, 1854 | 7 | 6 | 1 | 0 | |||
| Vermont | District | September 5, 1854 | 3 | 3 | 0 | 0 | |||
| California | At-large | September 6, 1854 | 2 | 0 | 2 | 0 | |||
| Maine | District | September 11, 1854 | 6 | 5 | 1 | 0 | |||
| Florida | At-large | October 2, 1854 | 1 | 0 | 1 | 0 | |||
| South Carolina | District | October 9–10, 1854 | 6 | 0 | 6 | 0 | |||
| Indiana | District | October 10, 1854 | 11 | 9 | 2 | 0 | |||
| Ohio | District | October 10, 1854 | 21 | 21 | 0 | 0 | |||
| Pennsylvania | District | October 10, 1854 | 25 | 17 | 7 | 1 | |||
| Illinois | District | November 7, 1854 (Election Day)[lower-alpha 8] |
9 | 4 | 5 | 0 | |||
| Michigan | District | 4 | 3 | 1 | 0 | ||||
| New Jersey | District | 5 | 4 | 1 | 0 | ||||
| New York | District | 33 | 25 | 5 | 3 | ||||
| Wisconsin | District | 3 | 2 | 1 | 0 | ||||
| Massachusetts | District | November 12, 1854 | 11 | 0 | 0 | 11 | |||
| Delaware | At-large | November 14, 1854 | 1 | 0 | 0 | 1 | |||
| New Hampshire | District | March 13, 1855 | 3 | 0 | 0 | 3 | |||
| Connecticut | District | April 2, 1855 | 4 | 0 | 0 | 4 | |||
| Rhode Island | District | April 4, 1855 | 2 | 0 | 0 | 2 | |||
| Virginia | District | May 24, 1855 | 13 | 0 | 12 | 1 | |||
| North Carolina | District | August 2, 1855 | 8 | 0 | 5 | 3 | |||
| Tennessee | District | August 2, 1855 | 10 | 0 | 5 | 5 | |||
| Alabama | District | August 6, 1855 | 7 | 0 | 5 | 2 | |||
| Kentucky | District | August 6, 1855 | 10 | 0 | 4 | 6 | |||
| Texas | District | August 6, 1855 | 2 | 0 | 1 | 1 | |||
| Georgia | District | October 1, 1855 | 8 | 0 | 6 | 2 | |||
| Louisiana | District | November 5, 1855 | 4 | 0 | 3 | 1 | |||
| Mississippi | District[lower-alpha 9] | November 5–6, 1855 | 5 | 0 | 4 | 1 | |||
| Maryland | District | November 6, 1855 | 6 | 0 | 2 | 4 | |||
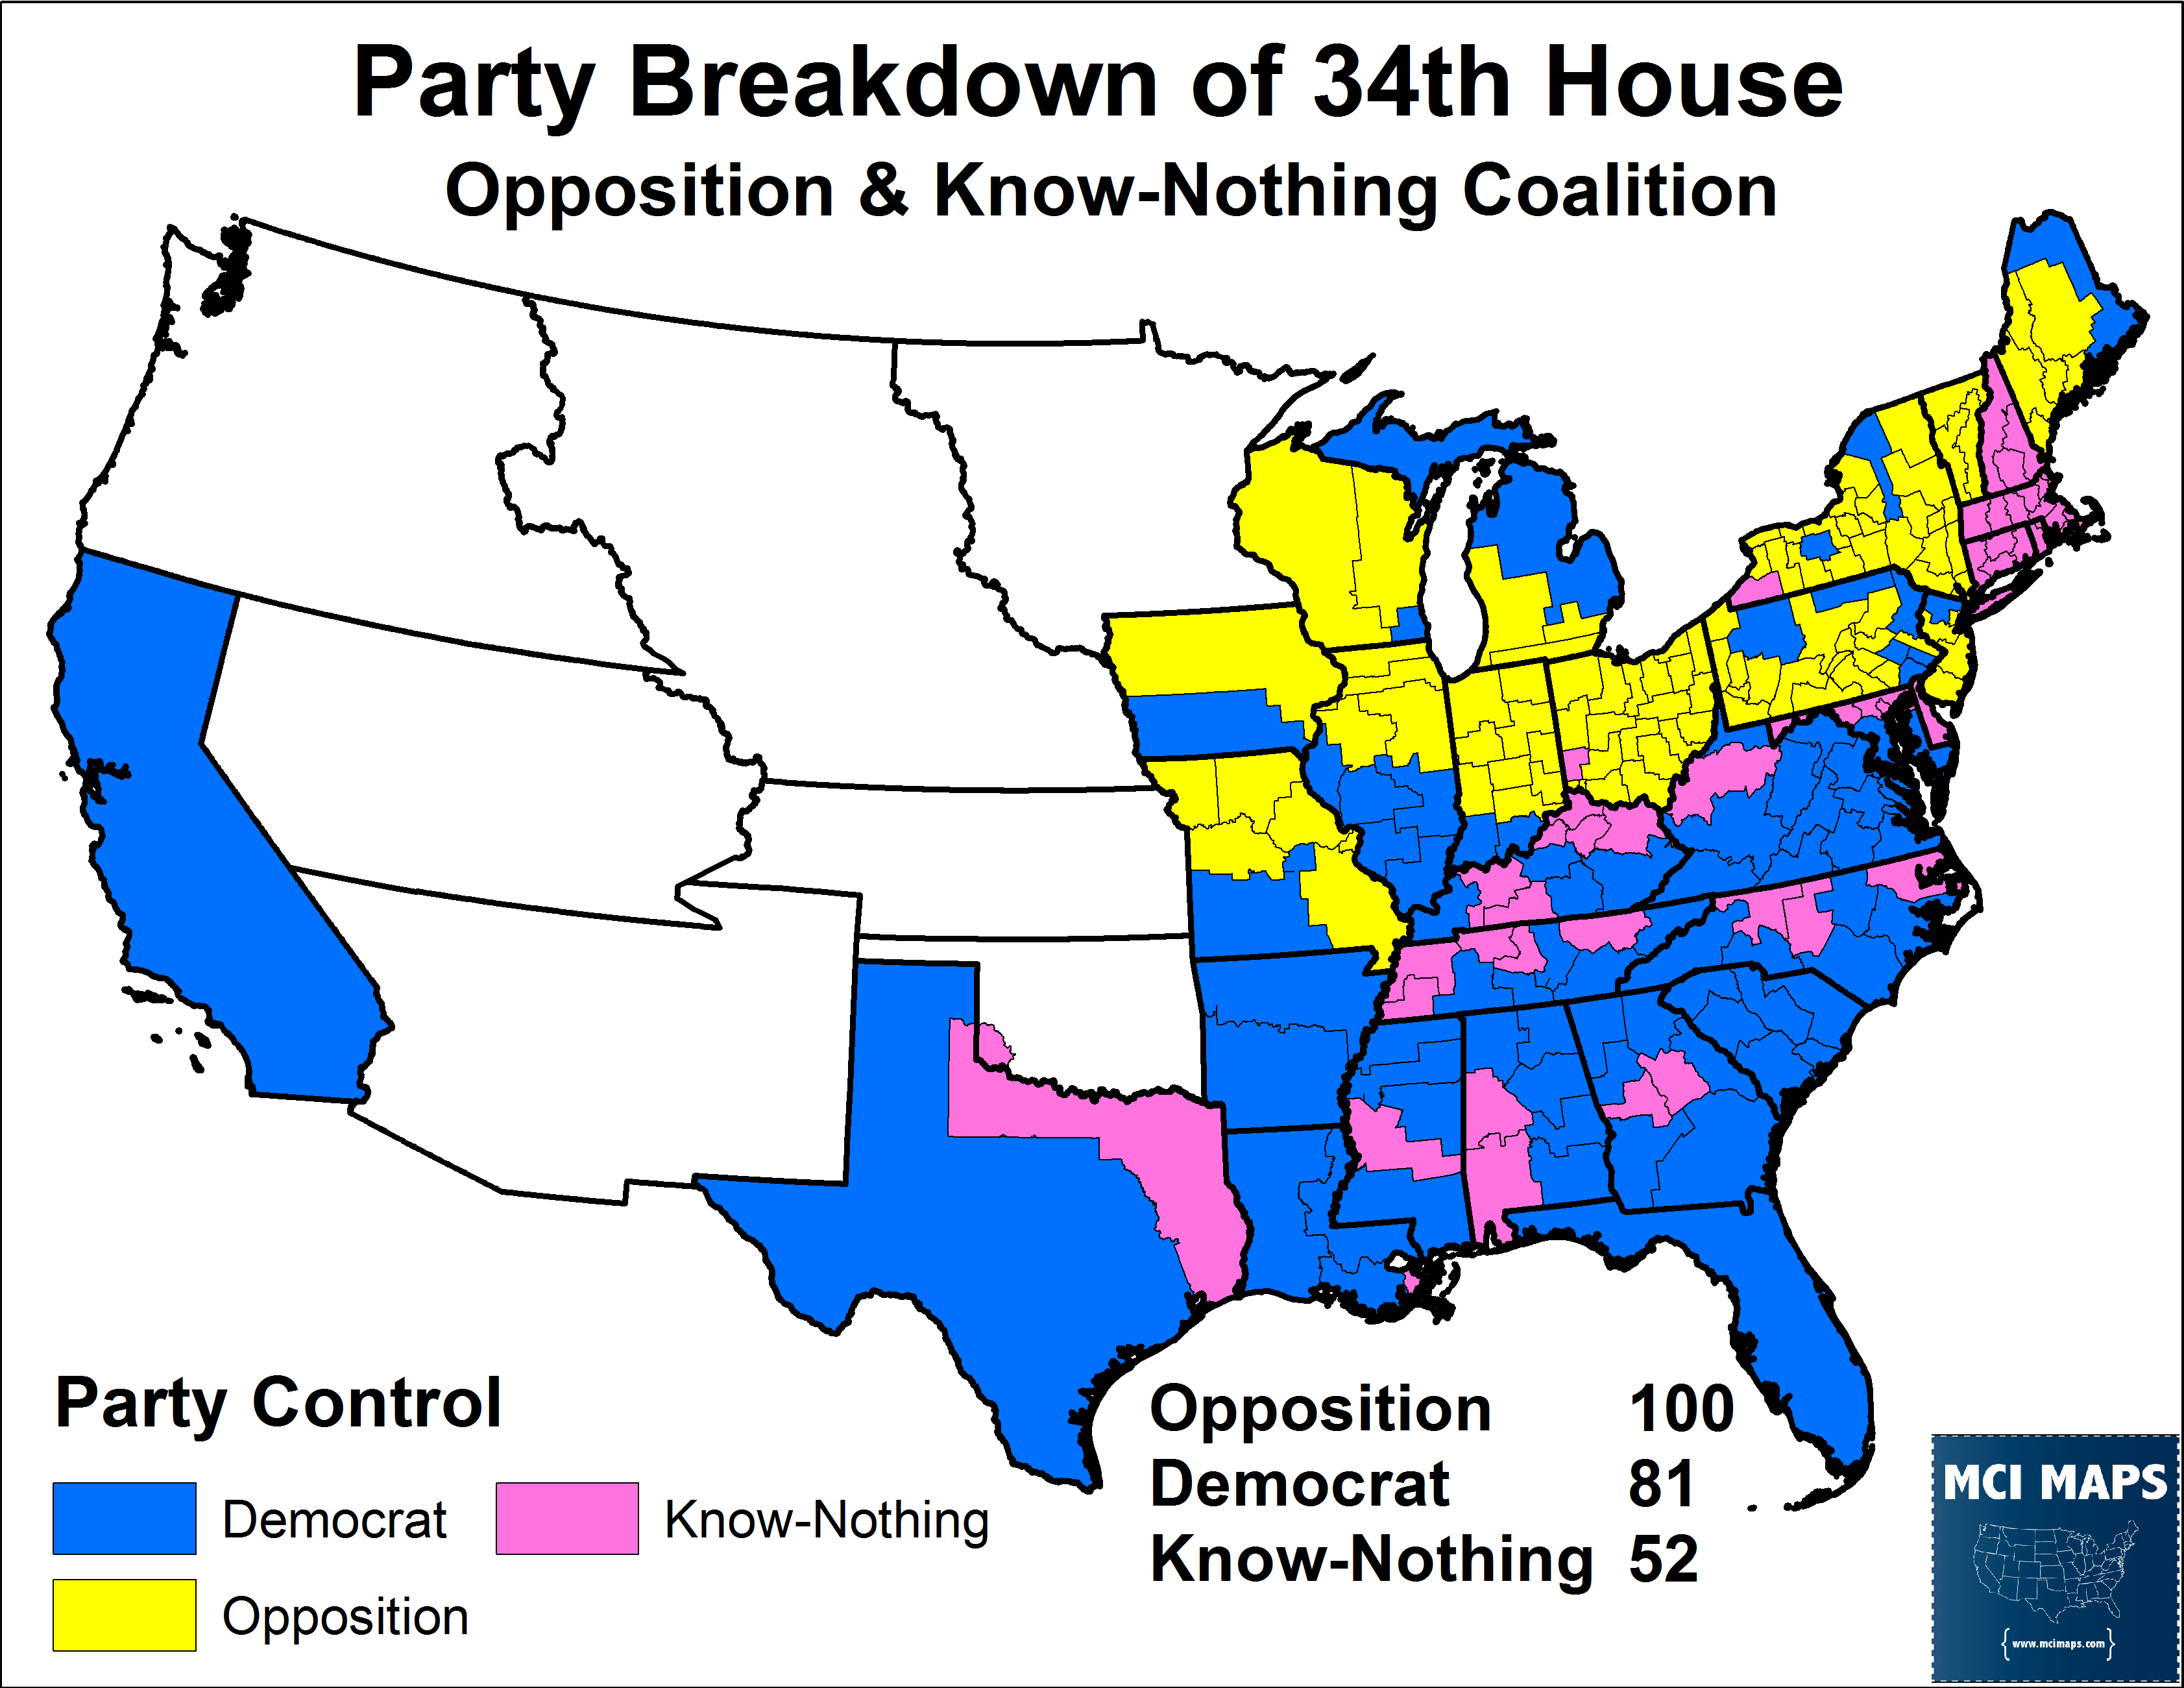
| Total | 234 | 100[2][3] 42.7% |
83[2][3] 35.0% |
51[2][3] 21.8% |
|||||
Arkansas
| District | Incumbent | Party | First elected |
Result | Candidates |
|---|---|---|---|---|---|
| Arkansas 1 | Alfred B. Greenwood | Democratic | 1852 | Incumbent re-elected. |
|
| Arkansas 2 | Edward A. Warren | Democratic | 1852 | Incumbent retired. New member elected. Democratic hold. |
|
California
Note: From statehood to 1864, California's representatives were elected at-large, with the top two vote-getters winning election from 1849 to 1858.
| District | Incumbent | This race | |||
|---|---|---|---|---|---|
| Member | Party | First elected | Results | Candidates | |
| California at-large 2 seats on a general ticket |
Milton S. Latham | Democratic | 1852 | Incumbent withdrew. New member elected. Democratic hold. |
|
| James A. McDougall | Democratic | 1852 | Incumbent lost re-election. New member elected. Democratic hold. | ||
Florida
| District | Incumbent | Party | First elected |
Result | Candidates |
|---|---|---|---|---|---|
| Florida at-large | Augustus Maxwell | Democratic | 1852 | Incumbent re-elected. | Thomas Brown (Whig) 44.74% |
Iowa
| District | Incumbent | Party | First elected |
Result | Candidates |
|---|---|---|---|---|---|
| Iowa 1 | Bernhart Henn | Democratic | 1850 | Incumbent retired. New member elected. Democratic hold. |
|
| Iowa 2 | William Vandever | Whig | 1852 | Incumbent retired. New member elected. Whig hold. |
|
Maine
| District | Incumbent | Party | First elected |
Result | Candidates |
|---|---|---|---|---|---|
| Maine 1 | Moses Macdonald | Democratic | 1850 | Incumbent retired. New member elected. Republican gain. |
|
| Maine 2 | Samuel Mayall | Democratic | 1852 | Incumbent retired. New member elected. Republican gain. |
|
| Maine 3 | E. Wilder Farley | Whig | 1852 | Incumbent lost re-election. New member elected. Republican gain. |
|
| Maine 4 | Samuel P. Benson | Whig | 1852 | Incumbent re-elected. Republican gain. |
|
| Maine 5 | Israel Washburn Jr. | Whig | 1850 | Incumbent re-elected. Republican gain. |
|
| Maine 6 | Thomas J. D. Fuller | Democratic | 1848 | Incumbent re-elected. |
|
Missouri
| District | Incumbent | Party | First elected |
Result | Candidates |
|---|---|---|---|---|---|
| Missouri 1 | Thomas Hart Benton | Benton Democratic (Opposition) | 1852 | Incumbent lost re-election. New member elected. Whig gain. |
|
| Missouri 2 | Alfred W. Lamb | Democratic | 1852 | Incumbent retired. New member elected. Whig gain. |
|
| Missouri 3 | James J. Lindley | Whig | 1852 | Incumbent re-elected. |
|
| Missouri 4 | Mordecai Oliver | Whig | 1852 | Incumbent re-elected. |
|
| Missouri 5 | John G. Miller | Whig | 1850 | Incumbent re-elected. |
|
| Missouri 6 | John S. Phelps | Democratic | 1844 | Incumbent re-elected. |
|
| Missouri 7 | Samuel Caruthers | Whig | 1852 | Incumbent re-elected. |
|
Pennsylvania
| District | Incumbent | Party | First elected |
Result | Candidates |
|---|---|---|---|---|---|
| Pennsylvania 1 | Thomas B. Florence | Democratic | 1848 | Incumbent re-elected. |
|
| Pennsylvania 2 | Joseph R. Chandler | Whig | 1848 | Incumbent lost re-election as an Independent. New member elected. Whig gain. |
|
| Pennsylvania 3 | John Robbins | Democratic | 1848 | Incumbent retired. New member elected. Whig gain. |
|
| Pennsylvania 4 | William Henry Witte | Democratic | 1852 | Incumbent retired. New member elected. Know Nothing gain. |
|
| Pennsylvania 5 | John McNair | Democratic | 1850 | Incumbent retired. New member elected. Democratic hold. |
|
| Pennsylvania 6 | William Everhart | Whig | 1852 | Incumbent retired. New member elected. Democratic gain. |
|
| Pennsylvania 7 | Samuel A. Bridges | Democratic | 1852 | Incumbent lost re-election. New member elected. Republican gain. |
|
| Pennsylvania 8 | J. Glancy Jones | Democratic | 1854 | Incumbent re-elected. |
|
| Pennsylvania 9 | Isaac E. Hiester | Whig | 1852 | Incumbent lost re-election. New member elected. Independent gain. |
|
| Pennsylvania 10 | Ner Middleswarth | Whig | 1852 | Incumbent retired. New member elected. Whig hold. |
|
| Pennsylvania 11 | Christian M. Straub | Democratic | 1852 | Incumbent retired. New member elected. Whig gain. |
|
| Pennsylvania 12 | Hendrick B. Wright | Democratic | 1852 | Incumbent lost re-election. New member elected. Whig gain. |
|
| Pennsylvania 13 | Asa Packer | Democratic | 1852 | Incumbent re-elected. |
|
| Pennsylvania 14 | Galusha A. Grow | Democratic | 1850 | Incumbent re-elected. |
|
Vermont
| District | Incumbent | Party | First elected |
Result | Candidates |
|---|---|---|---|---|---|
| Vermont 1 | James Meacham | Whig | 1849 (Special) | Incumbent re-elected. |
|
| Vermont 2 | Andrew Tracy | Whig | 1852 | Incumbent retired. New member elected. Republican gain. |
|
| Vermont 3 | Alvah Sabin | Whig | 1852 | Incumbent re-elected. |
|
Wisconsin
Election results in Wisconsin for 1854:[7]
| District | Incumbent | Party | First elected |
Result | Candidates |
|---|---|---|---|---|---|
| Wisconsin 1 | Daniel Wells Jr. | Democratic | 1852 | Incumbent re-elected. |
|
| Wisconsin 2 | Ben C. Eastman | Democratic | 1850 | Incumbent retired. New member elected. Republican gain. |
|
| Wisconsin 3 | John B. Macy | Democratic | 1852 | Incumbent lost re-election. New member elected. Opposition gain. |
|
Non-voting delegates
| District | Incumbent | This race | |||
|---|---|---|---|---|---|
| Delegate | Party | First elected | Results | Candidates | |
| Minnesota Territory | Henry Mower Rice | Democratic | 1852 | Incumbent re-elected. |
|
See also
- 1854 United States elections
- List of United States House of Representatives elections, 1824–54
- 1854 and 1855 United States Senate elections
- 33rd United States Congress
- 34th United States Congress
Notes
- Includes two Anti-Broderick Democrats (California), one Anti-Benton Democrat (Missouri), one Hard-Shell Democrat (New York), and four Soft-Shell Democrats (New York)
- Counted as part of the plurality-winning "Opposition Party."
- While Martis, et al. count 51 Know Nothings, Dubin (p. 174) counts 52.
- Includes votes for those who ran labeled as a Anti-Broderick Democrat, Anti-Benton Democrat, Hard Shell Democrat or Soft-Shell Democrat.
- Included one Independent Whig: Anthony Ellmaker Roberts of Pennsylvania.
- Includes votes for those who ran labeled as a Independent, Benton Democrat, Independent Democrat, or Independent American.
- Compared to Whigs, Free Soilers, and Independents elected in the previous election of 1852.
- In 1845, Congress passed a law providing for a uniform date for choosing presidential electors (see: Statutes at Large, 28th Congress, 2nd Session, p. 721). Congressional elections were unaffected by this law, but the date was gradually adopted by the states for Congressional elections as well.
- At-large district abolished in redistricting.
- Compared to just Whig Party members elected in the previous election of 1852. If Whig Party and Free Soil Party members are counted together, the increase was only

References
- http://mcimaps.com/wp-content/uploads/2018/01/34th-Congress.png
- Martis, pp. 108–109.
- "Party Divisions of the House of Representatives* 1789–Present". Office of the Historian, House of United States House of Representatives. Retrieved January 21, 2015.
- Dubin, p. 174.
- Nevins, Allan (1947). Ordeal of the Union, Volume II: A House Dividing 1852-1857. New York. pp. 413–415.
- https://www.ourcampaigns.com/RaceDetail.html?RaceID=115030
- "Wisconsin U.S. House Election Results" (PDF). Humphrey Institute of Public Affairs. Archived from the original (PDF) on April 5, 2012. Retrieved August 27, 2014.
- "Our Campaigns - MN Territorial Delegate Race - Aug 05, 1855". www.ourcampaigns.com.
Bibliography
- Dubin, Michael J. (March 1, 1998). United States Congressional Elections, 1788-1997: The Official Results of the Elections of the 1st Through 105th Congresses. McFarland and Company. ISBN 978-0786402830.
- Martis, Kenneth C. (January 1, 1989). The Historical Atlas of Political Parties in the United States Congress, 1789-1989. Macmillan Publishing Company. ISBN 978-0029201701.
- Moore, John L., ed. (1994). Congressional Quarterly's Guide to U.S. Elections (Third ed.). Congressional Quarterly Inc. ISBN 978-0871879967.
- "Party Divisions of the House of Representatives* 1789–Present". Office of the Historian, House of United States House of Representatives. Retrieved January 21, 2015.
External links
- Office of the Historian (Office of Art & Archives, Office of the Clerk, U.S. House of Representatives)