St. John's West (provincial electoral district)
St. John’s West is a provincial electoral district for the House of Assembly of Newfoundland and Labrador, Canada. As of 2011, there are 7,741 eligible voters living within the district.[1]
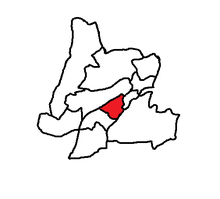 St. John's West in relation to other districts in St. John's | |||
| Provincial electoral district | |||
| Legislature | Newfoundland and Labrador House of Assembly | ||
| MHA |
Liberal | ||
| District created | 1949 | ||
| First contested | 1949 | ||
| Last contested | 2019 | ||
| Demographics | |||
| Population (2006) | 11,805 | ||
| Electors (2011) | 7,741 | ||
| Area (km²) | 10 | ||
| Census divisions | Division No. 1 | ||
| Census subdivisions | St. John's | ||
The district is largely residential and middle class and includes the Cowan Heights area. Prior to 1956, the district was larger and elected two MHAs.
The district is represented by Cabinet Minister Siobhan Coady.
Members of the House of Assembly
The district has elected the following Members of the House of Assembly:
| Member | Party | Term | |
|---|---|---|---|
| Siobhán Coady | Liberal | 2015–present | |
| Dan Crummell | Progressive Conservative | 2011–2015 | |
| Sheila Osborne | Progressive Conservative | 1997-2011 | |
| Rex Gibbons | Liberal | 1989-1997 | |
| Hal Barrett | Progressive Conservative | 1979-1989 | |
| Hubert Kitchen | Liberal | 1977-1979 | |
| John Crosbie | Progressive Conservative | 1966-1977 | |
| William G. Adams | Liberal | 1962-1966 | |
| Joseph R. Smallwood | Liberal | 1959-1962 | |
| Malcolm Hollett | Progressive Conservative | 1952-1959 | |
| Peter Cashin | Progressive Conservative | 1951-1956 | |
| Oliver Vardy | Liberal | 1949-1952 | |
| James Spratt | Liberal | 1949-1951 | |
Election results
| 2019 Newfoundland and Labrador general election | ||||||||
|---|---|---|---|---|---|---|---|---|
| Party | Candidate | Votes | % | |||||
| Liberal | Siobhan Coady | 2,393 | 45.7 | |||||
| Progressive Conservative | Shane Skinner | 2,211 | 42.2 | |||||
| New Democratic | Brenda Walsh | 633 | 12.1 | |||||
| Total valid votes | ||||||||
| Total rejected ballots | ||||||||
| Turnout | ||||||||
| Electors on the lists | – | |||||||
| Source: Elections Canada[3] | ||||||||
| 2015 Newfoundland and Labrador general election | ||||||||
|---|---|---|---|---|---|---|---|---|
| Party | Candidate | Votes | % | ±% | ||||
| Liberal | Siobhán Coady | 2,342 | 46.01 | +26.76 | ||||
| New Democratic | Earle McCurdy | 1,384 | 27.19 | -10.21 | ||||
| Progressive Conservative | Dan Crummell | 1,364 | 26.80 | -16.55 | ||||
| Total valid votes | 5,090 | 99.55 | ||||||
| Total rejected ballots | 23 | 0.45 | +0.23 | |||||
| Turnout | 5,113 | 55.59 | -4.01 | |||||
| Eligible voters | 9,198 | |||||||
| Liberal gain from Progressive Conservative | Swing | +21.66 | ||||||
| Source: Elections Newfoundland and Labrador[4] | ||||||||
| 2011 Newfoundland and Labrador general election | ||||||||
|---|---|---|---|---|---|---|---|---|
| Party | Candidate | Votes | % | ±% | ||||
| Progressive Conservative | Dan Crummell | 2,004 | 43.35 | -29.33 | ||||
| New Democratic | Chris Pickard | 1,729 | 37.40 | +30.50 | ||||
| Liberal | George Joyce | 890 | 19.25 | -1.17 | ||||
| Total valid votes | 4,623 | 99.78 | ||||||
| Total rejected ballots | 10 | 0.22 | ||||||
| Turnout | 4,633 | 59.60 | ||||||
| Eligible voters | 7,774 | |||||||
| 2007 Newfoundland and Labrador general election | ||||||||
|---|---|---|---|---|---|---|---|---|
| Party | Candidate | Votes | % | ±% | ||||
| Progressive Conservative | Sheila Osborne | 3,623 | 72.68 | -0.47 | ||||
| Liberal | George Joyce | 1,018 | 20.42 | -0.08 | ||||
| New Democratic | Joan Scott | 344 | 6.90 | -0.39 | ||||
| Party | Candidate | Votes | % | ± | |
|---|---|---|---|---|---|
| Progressive Conservative | Sheila Osborne | 4,557 | 72.21 | – | |
| Liberal | Tom Hann | 1,294 | 20.50 | ||
| NDP | Raj Sharan | 460 | 7.29 | ||
| Party | Candidate | Votes | % | ± | |
|---|---|---|---|---|---|
| Progressive Conservative | Sheila Osborne | 3,206 | 49.8 | – | |
| Liberal | Tom Moore | 2,532 | 39.3 | ||
| NDP | Pat Lynch | 683 | 10.6 | ||
| Party | Candidate | Votes | % | ± | |
|---|---|---|---|---|---|
| Liberal | Rex Gibbons | 4,152 | |||
| Progressive Conservative | Bren Kelly | 1,648 | – | – | |
| NDP | Pat Lynch | 651 | |||
| Party | Candidate | Votes | % | ± | |
|---|---|---|---|---|---|
| Liberal | Rex Gibbons | 3,094 | |||
| Progressive Conservative | Paul Sears | 2,485 | – | – | |
| NDP | Bonnie MacGillivray | 835 | |||
| Party | Candidate | Votes | % | ± | |
|---|---|---|---|---|---|
| Liberal | Rex Gibbons | 3,389 | |||
| Progressive Conservative | Hal Barrett | 2,583 | – | – | |
| NDP | Larry Power | 380 | |||
| Party | Candidate | Votes | % | ± | |
|---|---|---|---|---|---|
| Progressive Conservative | Harold Barrett | 3,382 | – | – | |
| Liberal | Gerald Moore | 1,595 | |||
| NDP | Thomas O'Leary | 1,508 | |||
| Party | Candidate | Votes | % | ± | |
|---|---|---|---|---|---|
| Progressive Conservative | Harold Barrett | 2,475 | – | – | |
| Liberal | Ronald Pumphrey | 755 | |||
| NDP | Ronald Lewis | 225 | |||
gollark: Your thing implies a central authority deciding what things are Bad™, which would be highly ungood.
gollark: Well, if they want to, I think they should for whatever stupid reason.
gollark: ++exec```pythonfrom itertools import chainÜ = ["ðdDÐ", "ÆÄAaæä", "włWŁ", "nN", "ØOÖøoö", "§sßs"]def þ(ŧ): ø = [""] for Ö in ŧ: ŋ = [] for Ä in Ö: for Ø in ø: ŋ.append(Ø + Ä) ø = ŋ return øprint("".join(þ(Ü)))```
gollark: You can't stop people from doing stupid things when drunk. Just don't get drunk if you're worried about it.
gollark: Also, I have made a script to generate all the DawnOSes:
References
- "Summary of Polling Divisions ST. JOHN'S WEST" (PDF). 3 August 2011. Retrieved 4 September 2011.
- CBC news NL votes 2007 district profiles
- "2015 Provincial General Election Report" (PDF). Elections Newfoundland and Labrador. 25 July 2016. Retrieved 16 May 2019.
- Newfoundland & Labrador Votes 2007. Canadian Broadcasting Corporation. Retrieved May 22, 2009.
- Newfoundland & Labrador Votes 2003. Canadian Broadcasting Corporation. Retrieved May 22, 2009.
- General Election Reports Archived 2011-07-06 at the Wayback Machine. Elections Newfoundland & Labrador.
- Report of the Chief Electoral Officer. Retrieved April 13, 2011.
External links
This article is issued from Wikipedia. The text is licensed under Creative Commons - Attribution - Sharealike. Additional terms may apply for the media files.