St. John's Centre
St. John’s Centre is a provincial electoral district for the House of Assembly of Newfoundland and Labrador, Canada. Much of the former district of St. John's Centre was renamed St. John's East in 1996. As of 2011 there were 7,846 eligible voters living within the district.[1]
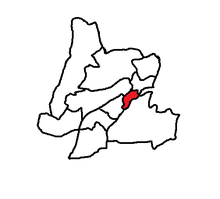 St. John's Centre in relation to other districts in St. John's | |||
| Provincial electoral district | |||
| Legislature | Newfoundland and Labrador House of Assembly | ||
| MHA |
New Democratic | ||
| District created | 1956 | ||
| First contested | 1956 | ||
| Last contested | 2019 | ||
| Demographics | |||
| Population (2011) | 14,354 | ||
| Electors (2015) | 9,732 | ||
| Area (km²) | 5 | ||
| Census divisions | Division No. 1 | ||
| Census subdivisions | St. John's (part) | ||
The district is bounded largely by Columbus Drive to the west, LeMarchant Road to the south, Parade Street to the east and Empire Avenue to the north. The residents are mostly working and middle-class.
Historically voters in the district have elected a member on the government side. A Progressive Conservative bastion for many years after Confederation, and an anti-Confederation area before that, St. John’s Centre shifted Liberal during the Wells and Tobin eras, though by fairly small margins. In 2011, NDP star candidate Gerry Rogers defeated PC cabinet minister Shawn Skinner. She was re-elected in 2015 and became NDP leader in 2018. Rogers retired in 2019 but former Newfoundland and Labrador Teachers’ Association president Jim Dinn held the seat for the NDP.
Members of the House of Assembly
The district has elected the following Members of the House of Assembly:
| Assembly | Years | Member | Party | |
|---|---|---|---|---|
| 31st | 1956–1959 | Augustine Michael Duffy | Progressive Conservative | |
| 32nd | 1959-1962 | United Newfoundland | ||
| 33rd | 1962-1966 | Anthony Joseph Murphy | Progressive Conservative | |
| 34th | 1966-1971 | |||
| 35th | 1972 | |||
| 36th | 1972-1975 | |||
| 37th | 1975-1979 | |||
| 38th | 1979-1982 | Patrick McNicholas | Progressive Conservative | |
| 39th | 1982-1985 | |||
| 40th | 1985-1989 | |||
| 41st | 1989-1993 | Hubert Kitchen | Liberal | |
| 42nd | 1993-1996 | |||
| 43rd | 1996-1999 | Joan Marie Aylward | Liberal | |
| 44th | 1999-2003 | |||
| 45th | 2003-2007 | Shawn Skinner | Progressive Conservative | |
| 46th | 2007-2011 | |||
| 47th | 2011-2015 | Gerry Rogers | New Democratic | |
| 48th | 2015-2019 | |||
| 49th | 2019–present | Jim Dinn | New Democratic | |
Election results
| 2019 Newfoundland and Labrador general election | ||||||||
|---|---|---|---|---|---|---|---|---|
| Party | Candidate | Votes | % | |||||
| New Democratic | Jim Dinn | 2,218 | 46.9 | |||||
| Progressive Conservative | Jonathan Galgay | 1,301 | 27.5 | |||||
| Liberal | Seamus O'Keefe | 1,207 | 25.5 | |||||
| Total valid votes | ||||||||
| Total rejected ballots | ||||||||
| Turnout | ||||||||
| Electors on the lists | – | |||||||
| Source: Elections Canada[2] | ||||||||
| 2015 Newfoundland and Labrador general election | ||||||||
|---|---|---|---|---|---|---|---|---|
| Party | Candidate | Votes | % | ±% | ||||
| New Democratic | Gerry Rogers | 2,195 | 47.64 | -6.80 | ||||
| Liberal | Lynn Sullivan | 1,923 | 41.73 | +39.42 | ||||
| Progressive Conservative | Kathie Hicks | 490 | 10.63 | -32.62 | ||||
| Total valid votes | 4,608 | 99.44 | – | |||||
| Total rejected ballots | 26 | 0.56 | – | |||||
| Turnout | 4,634 | 47.62 | -14.90 | |||||
| Eligible voters | 9,732 | |||||||
| New Democratic hold | Swing | -23.11 | ||||||
| Source: Elections Newfoundland and Labrador[3] | ||||||||
| 2011 Newfoundland and Labrador general election | ||||||||
|---|---|---|---|---|---|---|---|---|
| Party | Candidate | Votes | % | ±% | ||||
| New Democratic | Gerry Rogers | 2,569 | 54.44 | +39.52 | ||||
| Progressive Conservative | Shawn Skinner | 2,041 | 43.25 | -33.24 | ||||
| Liberal | Carly Bigelow | 109 | 2.31 | -6.28 | ||||
| Total valid votes | 4,719 | 99.73 | – | |||||
| Total rejected ballots | 13 | 0.27 | – | |||||
| Turnout | 4,732 | 62.52 | +4.63 | |||||
| Eligible voters | 7,569 | |||||||
| New Democratic gain from Progressive Conservative | Swing | +36.22 | ||||||
| Source: Elections Newfoundland and Labrador[4] | ||||||||
| 2007 Newfoundland and Labrador general election | ||||||||
|---|---|---|---|---|---|---|---|---|
| Party | Candidate | Votes | % | ±% | ||||
| Progressive Conservative | Shawn Skinner | 3,332 | 76.49 | +21.30 | ||||
| New Democratic | Jane Robinson | 650 | 14.92 | -0.84 | ||||
| Liberal | Lori Ann Campbell-Martino | 374 | 8.59 | -20.46 | ||||
| Total valid votes | 4,356 | 99.41 | – | |||||
| Total rejected ballots | 26 | 0.59 | – | |||||
| Turnout | 4,382 | 57.89 | -2.42 | |||||
| Eligible voters | 7,569 | |||||||
| Progressive Conservative hold | Swing | +11.07 | ||||||
| Source: Elections Newfoundland and Labrador[5] | ||||||||
| 2003 Newfoundland and Labrador general election | ||||||||
|---|---|---|---|---|---|---|---|---|
| Party | Candidate | Votes | % | ±% | ||||
| Progressive Conservative | Shawn Skinner | 3,349 | 55.19 | +15.61 | ||||
| Liberal | Joan Marie Aylward | 1,763 | 29.05 | -13.22 | ||||
| New Democratic | Carol Cantwell | 956 | 15.76 | -2.39 | ||||
| Total valid votes | 6,068 | 99.33 | – | |||||
| Total rejected ballots | 41 | 0.67 | – | |||||
| Turnout | 6,109 | 59.68 | -0.57 | |||||
| Eligible voters | 10,236 | |||||||
| Progressive Conservative gain from Liberal | Swing | +14.42 | ||||||
| Source: Elections Newfoundland and Labrador[6] | ||||||||
| 1999 Newfoundland and Labrador general election | ||||||||
|---|---|---|---|---|---|---|---|---|
| Party | Candidate | Votes | % | ±% | ||||
| Liberal | Joan Marie Aylward | 2,609 | 42.27 | -0.78 | ||||
| Progressive Conservative | Paul Brown | 2,443 | 39.58 | +1.96 | ||||
| New Democratic | Valerie Long | 1,120 | 18.15 | -1.18 | ||||
| Total valid votes | 6,172 | 99.29 | – | |||||
| Total rejected ballots | 44 | 0.71 | – | |||||
| Turnout | 6,216 | 60.25 | -5.63 | |||||
| Eligible voters | 10,317 | |||||||
| Liberal hold | Swing | -1.37 | ||||||
| Source: Elections Newfoundland and Labrador[7] | ||||||||
| 1996 Newfoundland and Labrador general election | ||||||||
|---|---|---|---|---|---|---|---|---|
| Party | Candidate | Votes | % | ±% | ||||
| Liberal | Joan Marie Aylward | 2,579 | 43.05 | -4.20 | ||||
| Progressive Conservative | Paul Brown | 2,254 | 37.62 | -1.32 | ||||
| New Democratic | Wayne Lucas | 1,158 | 19.33 | +5.52 | ||||
| Total valid votes | 5,991 | 99.42 | – | |||||
| Total rejected ballots | 35 | 0.58 | – | |||||
| Turnout | 6,026 | 65.88 | -0.11 | |||||
| Eligible voters | 9,147 | |||||||
| Liberal hold | Swing | -2.76 | ||||||
| Source: Elections Newfoundland and Labrador[8] | ||||||||
| 1993 Newfoundland and Labrador general election | ||||||||
|---|---|---|---|---|---|---|---|---|
| Party | Candidate | Votes | % | ±% | ||||
| Liberal | Hubert Kitchen | 2,990 | 47.25 | +1.11 | ||||
| Progressive Conservative | Paul Stapleton | 2,464 | 38.94 | -5.20 | ||||
| New Democratic | Fraser March | 874 | 13.81 | +4.09 | ||||
| Total valid votes | 6,328 | 99.45 | – | |||||
| Total rejected ballots | 35 | 0.55 | – | |||||
| Turnout | 6,363 | 65.99 | -13.53 | |||||
| Eligible voters | 9,643 | |||||||
| Liberal hold | Swing | +3.16 | ||||||
| Source: Elections Newfoundland and Labrador[9] | ||||||||
| 1989 Newfoundland and Labrador general election | ||||||||
|---|---|---|---|---|---|---|---|---|
| Party | Candidate | Votes | % | ±% | ||||
| Liberal | Hubert Kitchen | 2,967 | 46.14 | +12.04 | ||||
| Progressive Conservative | Patrick McNicholas | 2,838 | 44.14 | -6.83 | ||||
| New Democratic | Vicki Silk | 625 | 9.72 | -5.21 | ||||
| Total valid votes | 6,430 | 99.84 | – | |||||
| Total rejected ballots | 10 | 0.16 | – | |||||
| Turnout | 6,440 | 79.52 | +5.97 | |||||
| Eligible voters | 8,099 | |||||||
| Liberal gain from Progressive Conservative | Swing | +9.44 | ||||||
| Source: Elections Newfoundland and Labrador[10] | ||||||||
| 1985 Newfoundland general election | ||||||||
|---|---|---|---|---|---|---|---|---|
| Party | Candidate | Votes | % | ±% | ||||
| Progressive Conservative | Patrick McNicholas | 3,332 | 50.97 | -20.30 | ||||
| Liberal | Mary Frances Philpott | 2,229 | 34.10 | +14.23 | ||||
| New Democratic | Nina Patey | 976 | 14.93 | +6.07 | ||||
| Total valid votes | 6,537 | 99.68 | – | |||||
| Total rejected ballots | 21 | 0.32 | – | |||||
| Turnout | 6,558 | 73.55 | +0.75 | |||||
| Eligible voters | 8,916 | |||||||
| Progressive Conservative hold | Swing | -17.27 | ||||||
| Source: Elections Newfoundland and Labrador[11] | ||||||||
| 1982 Newfoundland general election | ||||||||
|---|---|---|---|---|---|---|---|---|
| Party | Candidate | Votes | % | ±% | ||||
| Progressive Conservative | Patrick McNicholas | 2,357 | 71.27 | +11.13 | ||||
| Liberal | John L. Slattery | 657 | 19.87 | -1.52 | ||||
| New Democratic | Robert Harry E. Cuff | 293 | 8.86 | -3.57 | ||||
| Total valid votes | 3,307 | 99.07 | – | |||||
| Total rejected ballots | 31 | 0.93 | – | |||||
| Turnout | 3,338 | 72.80 | -6.61 | |||||
| Eligible voters | 4,585 | |||||||
| Progressive Conservative hold | Swing | +6.33 | ||||||
| Source: Elections Newfoundland and Labrador[12] | ||||||||
| 1979 Newfoundland general election | ||||||||
|---|---|---|---|---|---|---|---|---|
| Party | Candidate | Votes | % | ±% | ||||
| Progressive Conservative | Patrick McNicholas | 2,173 | 60.14 | +0.56 | ||||
| Liberal | Hugh Joseph Shea | 773 | 21.39 | -2.69 | ||||
| New Democratic | Valerie Anne Summers | 449 | 12.43 | +12.43 | ||||
| Independent | Lewis Murphy | 128 | 3.54 | +3.54 | ||||
| Independent | Dorothy Mary Wyatt | 90 | 2.49 | +2.49 | ||||
| Total valid votes | 3,613 | 99.23 | – | |||||
| Total rejected ballots | 28 | 0.77 | – | |||||
| Turnout | 3,641 | 79.41 | +13.33 | |||||
| Eligible voters | 4,585 | |||||||
| Progressive Conservative hold | Swing | +1.63 | ||||||
| Source: Elections Newfoundland and Labrador[13] | ||||||||
| 1975 Newfoundland general election | ||||||||
|---|---|---|---|---|---|---|---|---|
| Party | Candidate | Votes | % | ±% | ||||
| Progressive Conservative | Anthony Joseph Murphy | 2,366 | 59.58 | -16.88 | ||||
| Liberal | William Doyle | 956 | 24.08 | +0.54 | ||||
| Reform Liberal | John Coyle | 649 | 16.34 | +16.34 | ||||
| Total valid votes | 3,971 | 99.45 | – | |||||
| Total rejected ballots | 22 | 0.55 | – | |||||
| Turnout | 3,993 | 66.08 | -7.53 | |||||
| Eligible voters | 6,043 | |||||||
| Progressive Conservative hold | Swing | -8.71 | ||||||
| Source: Elections Newfoundland and Labrador[14] | ||||||||
| 1972 Newfoundland general election | ||||||||
|---|---|---|---|---|---|---|---|---|
| Party | Candidate | Votes | % | ±% | ||||
| Progressive Conservative | Anthony Joseph Murphy | 3,580 | 76.46 | +9.03 | ||||
| Liberal | Denis Murphy | 1,102 | 23.54 | -5.41 | ||||
| Total valid votes | 4,682 | 99.19 | – | |||||
| Total rejected ballots | 38 | 0.81 | –0.15 | |||||
| Turnout | 4,720 | 73.61 | -12.98 | |||||
| Eligible voters | 6,412 | |||||||
| Progressive Conservative hold | Swing | +7.22 | ||||||
| Source: Elections Newfoundland and Labrador[15] | ||||||||
| 1971 Newfoundland general election | ||||||||
|---|---|---|---|---|---|---|---|---|
| Party | Candidate | Votes | % | |||||
| Progressive Conservative | Anthony Joseph Murphy | 3,708 | 67.43 | |||||
| Liberal | Leonard Levitz | 1,592 | 28.95 | |||||
| Independent | David Owens | 109 | 1.98 | |||||
| New Democratic | Graham Kelly | 90 | 1.64 | |||||
| Total valid votes | 5,499 | 99.05 | ||||||
| Total rejected ballots | 53 | 0.95 | ||||||
| Turnout | 5,552 | 86.59 | ||||||
| Eligible voters | 6,412 | |||||||
| Source: Canadian Elections Database[16] | ||||||||
References
- "Summary of Polling Divisions ST. JOHN'S CENTRE" (PDF). Elections Newfoundland and Labrador. 3 August 2011. Retrieved 4 September 2011.
- "2015 Provincial General Election Report" (PDF). Elections Newfoundland and Labrador. 25 July 2016. Retrieved 21 November 2018.
- "Report on the Provincial General Election, October 11, 2011" (PDF). Office of the Chief Electoral Officer of Newfoundland and Labrador. 8 June 2012. Retrieved 21 November 2018.
- "Report on the Provincial General Election, October 9, 2007" (PDF). Office of the Chief Electoral Officer of Newfoundland and Labrador. 7 July 2008. Retrieved 21 November 2018.
- "Report on the October 21, 2003 General Election" (PDF). Office of the Chief Electoral Officer of Newfoundland and Labrador. 9 July 2004. Retrieved 21 November 2018.
- "Report of the Chief Electoral Officer on the General Election for the Forty-Fourth General Assembly, February 9, 1999" (PDF). Office of the Chief Electoral Officer of Newfoundland and Labrador. 9 November 1999. Retrieved 21 November 2018.
- "Report of the Chief Electoral Officer on the General Election for the Forty-Third General Assembly, February 22, 1996" (PDF). Office of the Chief Electoral Officer of Newfoundland and Labrador. 28 October 1996. Retrieved 21 November 2018.
- "Report of the Chief Electoral Officer on the General Election for the Forty-Second General Assembly, May 3, 1993" (PDF). Office of the Chief Electoral Officer of Newfoundland and Labrador. 1994. Retrieved 21 November 2018.
- "Election Statistics 1989" (PDF). Office of the Chief Electoral Officer of Newfoundland and Labrador. 1989. Retrieved 21 November 2018.
- "Election Returns 1985" (PDF). Office of the Chief Electoral Officer of Newfoundland and Labrador. 22 October 1985. Retrieved 21 November 2018.
- "Election Returns 1982" (PDF). Office of the Chief Electoral Officer of Newfoundland and Labrador. 25 August 1982. Retrieved 21 November 2018.
- "Election Returns 1979" (PDF). Office of the Chief Electoral Officer of Newfoundland and Labrador. 12 October 1979. Retrieved 22 November 2018.
- "Election Returns 1975" (PDF). Office of the Chief Electoral Officer of Newfoundland and Labrador. 30 April 1976. Retrieved 22 November 2018.
- "General Election Returns, March 24, 1972" (PDF). Office of the Chief Electoral Officer of Newfoundland and Labrador. 1973. Retrieved 22 November 2018.
- "1971 Newfoundland and Labrador Election". Canadian Elections Database. Retrieved 16 May 2019.