Spectral power distribution
In radiometry, photometry, and color science, a spectral power distribution (SPD) measurement describes the power per unit area per unit wavelength of an illumination (radiant exitance). More generally, the term spectral power distribution can refer to the concentration, as a function of wavelength, of any radiometric or photometric quantity (e.g. radiant energy, radiant flux, radiant intensity, radiance, irradiance, radiant exitance, radiosity, luminance, luminous flux, luminous intensity, illuminance, luminous emittance).[1][2][3][4]
Knowledge of the SPD is crucial for optical-sensor system applications. Optical properties such as transmittance, reflectivity, and absorbance as well as the sensor response are typically dependent on the incident wavelength.[3]
Physics
Mathematically, for the spectral power distribution of a radiant exitance or irradiance one may write:

where M(λ) is the spectral irradiance (or exitance) of the light (SI units: W/m3 = kg·m−1·s−3); Φ is the radiant flux of the source (SI unit: watt, W); A is the area over which the radiant flux is integrated (SI unit: square meter, m2); and λ is the wavelength (SI unit: meter, m). (Note that it is more convenient to express the wavelength of light in terms of nanometers; spectral exitance would then be expressed in units of W·m−2·nm−1.) The approximation is valid when the area and wavelength interval are small.[5]
Relative SPD
The ratio of spectral concentration (irradiance or exitance) at a given wavelength to the concentration of a reference wavelength provides the relative SPD.[4] This can be written as:

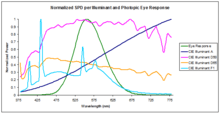
For instance, the luminance of lighting fixtures and other light sources are handled separately, a spectral power distribution may be normalized in some manner, often to unity at 555 or 560 nanometers, coinciding with the peak of the eye's luminosity function.[2][6]
Responsivity
The SPD can be used to determine the response of a sensor at a specified wavelength. This compares the output power of the sensor to the input power as a function of wavelength.[7] This can be generalized in the following formula:

Knowing the responsitivity is beneficial for determination of illumination, interactive material components, and optical components to optimize performance of a system's design.
Source SPD and matter
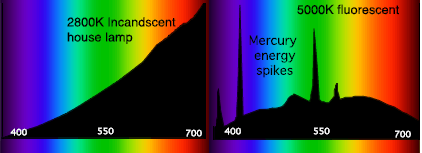
The spectral power distribution over the visible spectrum from a source can have varying concentrations of relative SPDs. The interactions between light and matter affect the absorption and reflectance properties of materials and subsequently produces a color that varies with source illumination.[8]
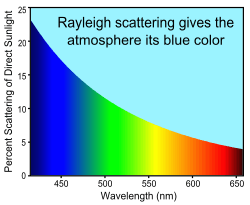
For example, the relative spectral power distribution of the sun produces a white appearance if observed directly, but when the sunlight illuminates the Earth's atmosphere the sky appears blue under normal daylight conditions. This stems from the optical phenomenon called Rayleigh scattering which produces a concentration of shorter wavelengths and hence the blue color appearance.[3]
Source SPD and color appearance
The human visual response relies on trichromacy to process color appearance. While the human visual response integrates over all wavelengths, the relative spectral power distribution will provide color appearance modeling information as the concentration of wavelength band(s) will become the primary contributors to the perceived color.[8]
This becomes useful in photometry and colorimetry as the perceived color changes with source illumination and spectral distribution and coincides with metamerisms where an object's color appearance changes.[8]
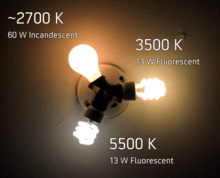
The spectral makeup of the source can also coincide with color temperature producing differences in color appearance due to the source's temperature.[4]
See also
- Color
- Lighting
- Photometry (optics)
- Physical quantities
- Radiometry
- Spectral density estimation
References
- Mark D. Fairchild (2005). Color Appearance Models. John Wiley and Sons. ISBN 0-470-01216-1.
- Michael R. Peres (2007). The Focal Encyclopedia of Photography. Focal Press. ISBN 978-0-240-80740-9.
- William Ross McCluney (1994). Introduction to Radiometry and Photometry. Boston: Artech House. ISBN 0890066787.
- Franc C. Grum (1979). Optical Radiation Measurements (v. 1). New York: Academic Press. ISBN 0123049016.
- Clair L. Wyatt (1987). Radiometric System Design. New York: Macmillan. ISBN 0029488001.
- Wyszecki, Günter; Stiles, Walter Stanley (1982). Color Science: Concepts and Methods; Quantitative Data and Formulae (second ed.). New York: Wiley. ISBN 978-0-471-39918-6.
- Robert W. Boyd (1983). Radiometry and the Detection of Optical Radiation. New York: Wiley. ISBN 047186188X.
- William David Wright (1969). The Measurement of Colour. New York: Van Nostrand Reinhold Co.
External links
- Spectral Power Distribution Curves, GE Lighting.
Color topics | ||||||||
|---|---|---|---|---|---|---|---|---|
| Color science |
|  | ||||||
| Color philosophy |
| |||||||
| Color terms |
| |||||||
| Color organizations | ||||||||
| Lists | ||||||||
| Related |
| |||||||
| ||||||||