Scree plot
In multivariate statistics, a scree plot is a line plot of the eigenvalues of factors or principal components in an analysis.[1] The scree plot is used to determine the number of factors to retain in an exploratory factor analysis (FA) or principal components to keep in a principal component analysis (PCA). The procedure of finding statistically significant factors or components using a scree plot is also known as a scree test. Raymond B. Cattell introduced the scree plot in 1966.[2]
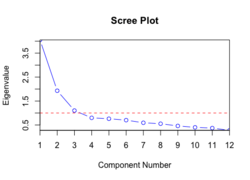
A scree plot always displays the eigenvalues in a downward curve, ordering the eigenvalues from largest to smallest. According to the scree test, the "elbow" of the graph where the eigenvalues seem to level off is found and factors or components to the left of this point should be retained as significant.[3]
Etymology
The scree plot is named after its resemblance to a scree after its elbow.
Criticism
This test is sometimes criticized for its subjectivity. Scree plots can have multiple "elbows" that make it difficult to know the correct number of factors or components to retain, making the test unreliable. There is also no standard for the scaling of the x and y axes, which means that different statistical programs can produce different plots from the same data.[4]
The test has also been criticized for producing too few factors or components for factor retention.[1]
A more objective version of the scree test has been proposed called the Cattell–Nelson–Gorsuch scree test (CNG scree test).
See also
- Biplot
- Parallel analysis

References
- George Thomas Lewith; Wayne B. Jonas; Harald Walach (23 November 2010). Clinical Research in Complementary Therapies: Principles, Problems and Solutions. Elsevier Health Sciences. p. 354. ISBN 0-7020-4916-6.
- Cattell, Raymond B. (1966). "The Scree Test For The Number Of Factors". Multivariate Behavioral Research. 1 (2): 245–276. doi:10.1207/s15327906mbr0102_10. PMID 26828106.
- Alex Dmitrienko; Christy Chuang-Stein; Ralph B. D'Agostino (2007). Pharmaceutical Statistics Using SAS: A Practical Guide. SAS Institute. p. 380. ISBN 978-1-59994-357-2.
- Geoffrey R. Norman; David L. Streiner (15 September 2007). Biostatistics: The Bare Essentials. PMPH-USA. p. 201. ISBN 978-1-55009-400-8.