Results of the 2015 Canadian federal election
The 42nd Canadian federal election was held on October 19, 2015. The incumbent Conservative Party of Canada of Prime Minister Stephen Harper, in office since 2006, was defeated by the Liberal Party of Canada under the leadership of Justin Trudeau. The Liberals rebounded from third place in the House of Commons with 36 seats to a strong majority government with 184 of the 338 seats in the expanded Commons. The Liberals picked up 148 seats, easily the biggest numerical increase for a Canadian party since Confederation.
| |||||||||||||||||||||||||||||||
This lists parties that won seats. See the complete results below. | |||||||||||||||||||||||||||||||
| |||||||||||||||||||||||||||||||
Result overview
| 184 | 99 | 44 | 10 | 1 |
| Liberal | Conservative | New Democratic | B |
G |
At 9:41pm EDT, October 19, 2015, CBC News projected that the Liberals had won at least a minority government, and that leader Justin Trudeau would become the next Prime Minister of Canada. Less than an hour later, at 10:36pm EDT, CBC News projected a Liberal majority. The New Democratic Party lost more than half the seats they had held, with Tom Mulcair becoming the first major party leader to concede defeat. The Conservatives dropped down to 99 seats to form the main opposition party, and Stephen Harper resigned as leader of the Conservative Party. The Bloc Québécois regained some ridings they had lost in the previous election, but party leader Giles Duceppe failed to regain the seat he lost back in 2011. Green Party leader Elizabeth May kept her seat.[1]
According to preliminary figures from Elections Canada, more than 68 per cent of eligible voters cast a ballot, or about 17,546,697 registered electors—a seven percentage point increase from the 2011 federal election, when turnout was just more than 61 per cent.[2]
Summary analysis
| Party | Votes | Seats | |||
|---|---|---|---|---|---|
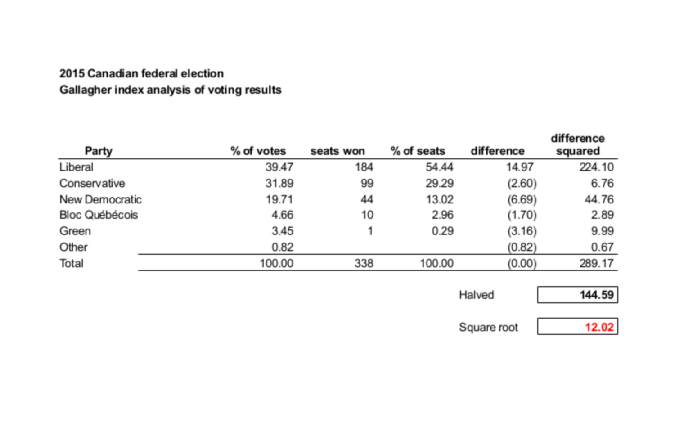
| Liberal | 6,930,136 | 39.5% |
184 / 338 (54%) | ||
| Conservative | 5,600,496 | 31.9% |
99 / 338 (29%) | ||
| New Democratic | 3,461,262 | 19.7% |
44 / 338 (13%) | ||
| Bloc Québécois | 818,652 | 4.7% |
10 / 338 (3%) | ||
| Green | 605,864 | 3.4% |
1 / 338 (0.3%) | ||
| Party | 2011 (redist.) |
Gain from (loss to) | 2015 | |||||
|---|---|---|---|---|---|---|---|---|
| Lib | Con | NDP | BQ | Grn | ||||
| Liberal | 36 | 96 | 51 | 1 | 184 | |||
| Conservative | 188 | (96) | (3) | 99 | ||||
| New Democratic | 109 | (51) | 3 | (7) | 44 | |||
| Bloc Québécois | 4 | (1) | 7 | 10 | ||||
| Green | 1 | 1 | ||||||
| Total | 338 | (148) | 99 | 55 | (6) | 338 | ||
| Party in 1st place | Party in 2nd place | Total | ||||||
|---|---|---|---|---|---|---|---|---|
| Lib | Con | NDP | BQ | Grn | Ind | |||
| Liberal | 111 | 64 | 8 | 1 | 184 | |||
| Conservative | 81 | 18 | 99 | |||||
| New Democratic | 29 | 11 | 3 | 1 | 44 | |||
| Bloc Québécois | 8 | 2 | 10 | |||||
| Green | 1 | 1 | ||||||
| Total | 118 | 123 | 84 | 11 | 1 | 1 | 338 | |
| Parties | Seats | |
|---|---|---|
| █ Liberal | █ Conservative | 192 |
| █ Liberal | █ New Democratic | 93 |
| █ Conservative | █ New Democratic | 29 |
| █ Liberal | █ Bloc Québécois | 16 |
| █ New Democratic | █ Bloc Québécois | 5 |
| █ Liberal | █ Independent | 1 |
| █ Conservative | █ Green | 1 |
| █ New Democratic | █ Green | 1 |
| Total | 338 | |
| Party in 1st place | >50% | 45-49.9% | 40-44.9% | 35-39.9% | <35% | Total | |
|---|---|---|---|---|---|---|---|
| Liberal | 87 | 48 | 26 | 13 | 10 | 184 | |
| Conservative | 42 | 24 | 20 | 8 | 5 | 99 | |
| New Democratic | 3 | 4 | 12 | 14 | 11 | 44 | |
| Bloc Québécois | 2 | 1 | 7 | 10 | |||
| Green | 1 | 1 | |||||
| Total | 133 | 76 | 60 | 36 | 33 | 338 | |
Detailed analysis
Turnout
The election was notable for seeing voter turnout rise across all ages and sexes, and especially significant for the rise in younger voters. In particular, there was an increase of 1.2 million voters among those under the age of 35.[5]
| Age | 2015 | 2011 | ∆% | ||||||
|---|---|---|---|---|---|---|---|---|---|
| Total | Male | Female | Total | Male | Female | Total | Male | Female | |
| Canada | 66.1 | 64.1 | 68.0 | 58.5 | 57.3 | 59.6 | |||
| 18 to 24 years | 57.1 | 53.8 | 60.5 | 38.8 | 36.9 | 40.9 | |||
| 1st time voters | 58.3 | 54.9 | 61.9 | 40.5 | 38.4 | 42.8 | |||
| Not 1st time | 55.1 | 52.0 | 58.3 | 37.8 | 36.0 | 39.8 | |||
| 25 to 34 years | 57.4 | 54.3 | 60.5 | 45.1 | 42.5 | 47.7 | |||
| 35 to 44 years | 61.9 | 58.7 | 65.1 | 54.5 | 51.5 | 47.5 | |||
| 45 to 54 years | 66.6 | 63.6 | 69.6 | 64.5 | 62.1 | 66.9 | |||
| 55 to 64 years | 73.7 | 71.4 | 76.0 | 71.5 | 70.7 | 72.2 | |||
| 65 to 74 years | 78.8 | 79.0 | 78.6 | 75.1 | 77.4 | 73.1 | |||
| 75 years and over | 67.4 | 74.1 | 62.8 | 60.3 | 69.5 | 54.2 | |||
Geographic voting distributions
- 2015 Results by Riding and Voting Strength by Party
.svg.png) Seats won overall
Seats won overall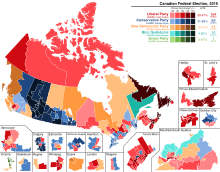 Seats won overall, graded by strength of winning party
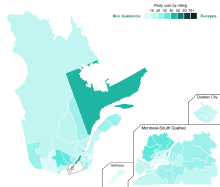 Bloc Québécois
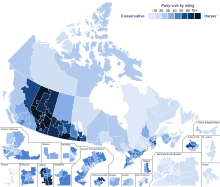 Conservative
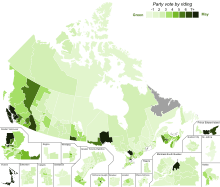 Green
Green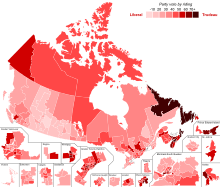 Liberal
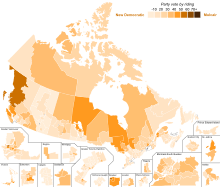 NDP
NDP
- 2015 Results by Riding
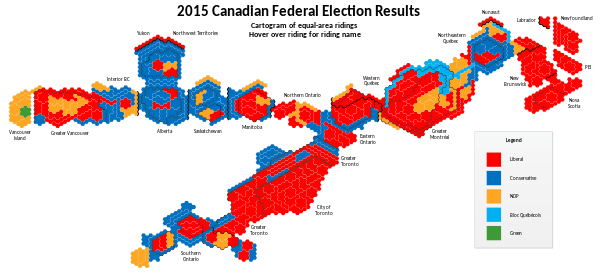 Seats won by riding - equal-area riding map
Party summaries
Liberals
In the previous election, the Liberals were cut down to 34 seats, the fewest they had ever won in their history. It was the first time since the nation's founding that the Liberals had not been either in government or the Official Opposition. They picked up one additional seat in a by-election and one via a floor-crossing.
While the Liberals had been expected to regain much of what they had lost in 2011, they tallied the second-best performance in their history; the 184 seats was bettered only by the 191 they won in 1949. It was also the most seats that a party had won since the Progressive Conservatives won a record 211 in 1984.
The Liberal victory came mainly on the strength of a solid performance in the eastern part of the country. They took every seat in Atlantic Canada and Toronto, and won all but one seat in Ottawa. Most notably, they won 40 of Quebec's 78 seats, mostly on the strength of taking all but five seats in Montreal. It was the first time since 1980 that the Liberals had won the most seats in Quebec.
After going into the election with only four seats west of Ontario, the Liberals had their best showing in Western Canada in more than two decades. They not only took all but one seat in Winnipeg and all but two seats in Vancouver, but won seats in Alberta for the first time since 2004. Notably, they won two seats in Calgary; they had won only three seats there in their entire history prior to 2015, with their last win dating back to 1968. They were the only party to win seats in every province.
Conservatives
The Conservatives lost 60 seats to become the Official Opposition. They held their own in their heartlands of rural western Canada and central Ontario, and managed a respectable showing in southwestern Ontario and the more rural areas of eastern Ontario. However, they suffered heavy losses in urban southern Ontario, a region which had swung heavily to them in 2011. They lost all of their seats in Toronto itself and all but three in the 905 region. They also lost all of their seats in Winnipeg and Vancouver, as well as Atlantic Canada. It is the first time in decades that there are no centre-right MPs east of Quebec. They did, however, manage to make some gains in francophone areas of Quebec, mostly at the expense of the NDP.
Several members of Harper's cabinet were defeated, including Bernard Valcourt, Leona Aglukkaq, Gail Shea, Chris Alexander, Joe Oliver and Julian Fantino among others.
New Democrats
The NDP, the Official Opposition in the previous parliament, fell to third place with 44 seats, losing more than half of their caucus. For the most part, their support bled over to the Liberals, though they lost a few areas of francophone Quebec to the Conservatives and Bloc.
Bloc Québecois
The Bloc made a modest recovery after being nearly decimated in 2011, rebounding to 10 seats. However, Gilles Duceppe, who had been the longest-serving party leader in Canada at the time of his defeat in 2011, failed to win back his old seat of Laurier—Sainte-Marie. The party also received a smaller share of the popular vote than in the last election. As such, their gains could be attributable to NDP-Liberal vote splitting in francophone ridings more than a surge in popular support.
Contributing factors to party success
The parties had varying degrees of success by region and by socioeconomic factors. An analysis by The Globe and Mail shortly after the election was held revealed significant differences:[8]
| Region | Income (Median household) | Unemployment rate | Visible minority population | ||||||||||||||||||||||||||||||||||||||||||||||||||||||||||||||||||||||||||||||||||||||||||||||||||||
|---|---|---|---|---|---|---|---|---|---|---|---|---|---|---|---|---|---|---|---|---|---|---|---|---|---|---|---|---|---|---|---|---|---|---|---|---|---|---|---|---|---|---|---|---|---|---|---|---|---|---|---|---|---|---|---|---|---|---|---|---|---|---|---|---|---|---|---|---|---|---|---|---|---|---|---|---|---|---|---|---|---|---|---|---|---|---|---|---|---|---|---|---|---|---|---|---|---|---|---|---|---|---|---|
| <$35,810 | $35,810–$141,720 | >$141,720 | Low (4%–6%) | High (9%–22%) | Low (<2.41%) | High (>26.8%) | |||||||||||||||||||||||||||||||||||||||||||||||||||||||||||||||||||||||||||||||||||||||||||||||||
| Atlantic |
|
|
|
|
|
|
| ||||||||||||||||||||||||||||||||||||||||||||||||||||||||||||||||||||||||||||||||||||||||||||||||
| Quebec |
|
|
|
|
|
|
| ||||||||||||||||||||||||||||||||||||||||||||||||||||||||||||||||||||||||||||||||||||||||||||||||
| Ontario |
|
|
|
|
|
|
| ||||||||||||||||||||||||||||||||||||||||||||||||||||||||||||||||||||||||||||||||||||||||||||||||
| Prairies |
|
|
|
|
|
|
| ||||||||||||||||||||||||||||||||||||||||||||||||||||||||||||||||||||||||||||||||||||||||||||||||
| British Columbia |
|
|
|
|
|
N/A |
| ||||||||||||||||||||||||||||||||||||||||||||||||||||||||||||||||||||||||||||||||||||||||||||||||
| The North |
|
|
|
|
|
|
| ||||||||||||||||||||||||||||||||||||||||||||||||||||||||||||||||||||||||||||||||||||||||||||||||
Results by province
| Party name | BC | AB | SK | MB | ON | QC | NB | NS | PE | NL | YT | NT | NU | Total | ||
|---|---|---|---|---|---|---|---|---|---|---|---|---|---|---|---|---|
| Liberal | Seats: | 17 | 4 | 1 | 7 | 80 | 40 | 10 | 11 | 4 | 7 | 1 | 1 | 1 | 184 | |
| Vote: | 35.2 | 24.6 | 23.9 | 44.6 | 44.8 | 35.7 | 51.6 | 61.9 | 58.3 | 64.5 | 53.6 | 48.3 | 47.2 | 39.5 | ||
| Conservative | Seats: | 10 | 29 | 10 | 5 | 33 | 12 | – | – | – | – | – | – | – | 99 | |
| Vote: | 30.0 | 59.5 | 48.5 | 37.3 | 35.0 | 16.7 | 25.3 | 17.9 | 19.3 | 10.3 | 24.0 | 18.0 | 24.8 | 31.9 | ||
| New Democratic Party | Seats: | 14 | 1 | 3 | 2 | 8 | 16 | – | – | – | – | – | – | – | 44 | |
| Vote: | 25.9 | 11.6 | 25.1 | 13.8 | 16.6 | 25.4 | 18.3 | 16.4 | 16.0 | 21.0 | 19.5 | 30.8 | 26.5 | 19.7 | ||
| Bloc Québécois | Seats: | – | – | – | – | – | 10 | – | – | – | – | – | – | – | 10 | |
| Vote: | – | – | – | – | – | 19.3 | – | – | – | – | – | – | – | 4.7 | ||
| Green | Seats: | 1 | – | – | – | – | – | – | – | – | – | – | – | – | 1 | |
| Vote: | 8.2 | 2.5 | 2.1 | 3.2 | 2.9 | 2.3 | 4.6 | 3.4 | 6.0 | 1.1 | 2.9 | 2.8 | 1.5 | 3.4 | ||
| Independent and no affiliation | Vote: | 0.1 | 0.8 | 0.2 | 0.6 | 0.2 | 0.1 | 0.1 | 0.3 | – | 2.9 | – | – | – | 0.2 | |
| Total seats | 42 | 34 | 14 | 14 | 121 | 78 | 10 | 11 | 4 | 7 | 1 | 1 | 1 | 338 | ||
10 closest ridings
| Electoral district | 1st-place candidate | 2nd-place candidate | Won by | Confirmed on recount[9] | |||
|---|---|---|---|---|---|---|---|
| Elmwood—Transcona | MB | Daniel Blaikie | Lawrence Toet | 61 votes | |||
| Desnethé—Missinippi—Churchill River | SK | Georgina Jolibois | Lawrence Joseph | 71 votes | |||
| Barrie—Springwater—Oro-Medonte | ON | Alex Nuttall | Brian Tamblyn | 86 votes | |||
| Edmonton Mill Woods | AB | Amarjeet Sohi | Tim Uppal | 92 votes | |||
| Regina—Lewvan | SK | Erin Weir | Trent Fraser | 132 votes | |||
| Hastings—Lennox and Addington | ON | Mike Bossio | Daryl Kramp | 225 votes | |||
| Kitchener—Conestoga | ON | Harold Albrecht | Tim Louis | 251 votes | |||
| Montmagny—L'Islet—Kamouraska—Rivière-du-Loup | QC | Bernard Généreux | Marie-Josée Normand | 272 votes | |||
| Kootenay—Columbia | BC | Wayne Stetski | David Wilks | 282 votes | |||
| Jonquière | QC | Karine Trudel | Marc Pettersen | 339 votes | |||
Retiring & defeated incumbents
Notional gains
As a result of the 2012 federal electoral redistribution, thirty new ridings were added and many riding boundaries were changed, so several incumbent MPs who ran chose to do so in new ridings. The following table identifies the subsequent nominees in their old ridings and who they lost to.
New seats
As a result of the 2012 federal electoral redistribution, thirty new ridings were added and many riding boundaries were changed, so several ridings did not have an Incumbent. The following table identifies what party would have held the redistributed ridings based on 2011 results for the new riding and the subsequent MP who was elected. Some of these seats did have incumbents from other districts running.
Notes
References
- "Canada Election 2015 Live Results CBC". CBC.ca.
- "Voter turnout spikes after long, unpredictable campaign". cbc.ca. October 20, 2015.
- Daniel Schwartz (October 21, 2015). "Going deeper into Canada's 2015 federal election results". CBC News.
- Antony Green (October 21, 2015). "Canada 2015 - Would Preferential Voting Have Made a Difference?". blogs.abc.net.au. Australian Broadcasting Corporation.
- Clark, Campbell (June 15, 2016). "After 'a seismic shift' in voting, it's time to fill in the political trenches". The Globe and Mail.
- "Voter Turnout by Age Group" (PDF). Elections Canada. 2016.
- "Voter turnout by sex and age" (PDF). Elections Canada. 2016.
- Eric Andrew-Gee (October 21, 2015). "How Canadians voted". The Globe and Mail. pp. A8–A9.
- "Summary table of judicial recounts". elections.ca. 2015.
.jpg)
.jpg)