QuikSCAT
The NASA QuikSCAT (Quick Scatterometer) was an Earth observation satellite carrying the SeaWinds scatterometer. Its primary mission was to measure the surface wind speed and direction over the ice-free global oceans. Observations from QuikSCAT had a wide array of applications, and contributed to climatological studies, weather forecasting, meteorology, oceanographic research, marine safety, commercial fishing, tracking large icebergs, and studies of land and sea ice, among others. This SeaWinds scatterometer is referred to as the QuikSCAT scatterometer to distinguish it from the nearly identical SeaWinds scatterometer flown on the ADEOS-2 satellite.
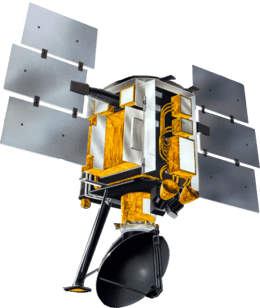
 Artist conception of QuikSCAT | |
| Mission type | Earth observation |
|---|---|
| Operator | NASA / JPL |
| COSPAR ID | 1999-034A |
| SATCAT no. | 25789 |
| Website | winds |
| Mission duration | 10 years, 4 months |
| Spacecraft properties | |
| Manufacturer | Ball Aerospace |
| Launch mass | 970 kilograms (2,140 lb) |
| Power | 874 watts |
| Start of mission | |
| Launch date | 19 June 1999, 02:15:00 UTC |
| Rocket | Titan II(23)G |
| Launch site | Vandenberg SLC-4W |
| End of mission | |
| Deactivated | 2 October 2018 |
| Orbital parameters | |
| Reference system | Geocentric |
| Regime | Sun-synchronous |
| Semi-major axis | 7,180.8 kilometers (4,461.9 mi) |
| Eccentricity | 0.0001431 |
| Perigee altitude | 807.9 kilometres (502.0 mi) |
| Apogee altitude | 809.8 kilometres (503.2 mi) |
| Inclination | 98.6175 degrees |
| Period | 100.93 minutes |
| RAAN | 101.8215 degrees |
| Argument of perigee | 71.6425 degrees |
| Mean anomaly | 308.4160 degrees |
| Mean motion | 14.27019630 |
| Repeat interval | ≈4 days (57 orbits) |
| Epoch | 30 September 2013, 12:15:56 UTC |
| Revolution no. | 74382 |
| Main Scatterometer | |
| Name | SeaWinds |
| Resolution | Nominal 25 km Standard (5 and 12.5 km special) |
Mission description
QuikSCAT was launched on 19 June 1999 with an initial 3-year mission requirement. QuikSCAT was a "quick recovery" mission replacing the NASA Scatterometer (NSCAT), which failed prematurely in June 1997 after just 9.5 months in operation. QuikSCAT, however, far exceeded these design expectations and continued to operate for over a decade before a bearing failure on its antenna motor ended QuikSCAT's capabilities to determine useful surface wind information on 23 November 2009. The QuikSCAT geophysical data record spans from 19 July 1999 to 21 November 2009. While the dish could not rotate after this date, its radar capabilities remained fully intact. It continued operating in this mode until full mission termination on October 2, 2018. Data from this mode of the mission was used to improve the accuracy of other satellite surface wind datasets by inter-calibrating other Ku-band scatterometers.
QuikSCAT measured winds in measurement swaths 1,800 km wide centered on the satellite ground track with no nadir gap, such as occurs with fan-beam scatterometers such as NSCAT. Because of its wide swath and lack of in-swath gaps, QuikSCAT was able to collect at least one vector wind measurement over 93% of the World's Oceans each day. This improved significantly over the 77% coverage provided by NSCAT. Each day, QuikSCAT recorded over 400,000 measurements of wind speed and direction. This is hundreds of times more surface wind measurements than are collected routinely from ships and buoys.
QuikSCAT provided measurements of the wind speed and direction referenced to 10 meters above the sea surface at a spatial resolution of 25 km. Wind information cannot be retrieved within 15–30 km of coastlines or in the presence of sea ice. Precipitation generally degrades the wind measurement accuracy,[1] although useful wind and rain information can still be obtained in mid-latitude and tropical cyclones for monitoring purposes.[2] In addition to measuring surface winds over the ocean, scatterometers such as QuikSCAT can also provide information on the fractional coverage of sea ice, track large icebergs (>5 km in length), differentiate types of ice and snow, and detect the freeze–thaw line in polar regions.
While the rotating dish antenna can no longer spin as designed, the rest of the instrument remains functional and data transmission capabilities remain intact, although it cannot determine the surface vector wind. It can, however, still measure radar backscatter at a fixed azimuth angle. QuikSCAT is being used in this reduced mode to cross-calibrate other scatterometers in hopes of providing long-term and consistent surface wind datasets over multiple on-orbit scatterometer platforms, including the operational European Organisation for the Exploitation of Meteorological Satellites (EUMETSAT) Advanced Scatterometer (ASCAT) on MetOp-A and MetOp-B, India's Oceansat-2 scatterometer operated by the Indian Space Research Organization (ISRO), and the China's HaiYang-2A (HY-2A) scatterometer operated by China's National Satellite Ocean Application Service, as well as future NASA scatterometer missions in development. A NASA Senior Review panel in 2011 endorsed the continuation of the QuikSCAT mission with these modified objectives through 2018. QuikSCAT was declared fully decommissioned on October 2, 2018.
Instrument description
SeaWinds used a rotating dish antenna with two spot beams that sweep in a circular pattern. The antenna consists of a 1-meter diameter rotating dish that produces two spot beams, sweeping in a circular pattern.[3] It radiates 110 W microwave pulses at a pulse repetition frequency (PRF) of 189 Hz. QuikSCAT operates at a frequency of 13.4 GHz, which is in the Ku-band of microwave frequencies. At this frequency, the atmosphere is mostly transparent to non-precipitating clouds and aerosols, although rain produces significant alteration of the signal.[4]
The spacecraft is in a sun-synchronous orbit, with equatorial crossing times of ascending swaths at about 06:00 LST ±30 minutes. Along the equator, consecutive swaths are separated by 2,800 km. QuikSCAT orbits Earth at an altitude of 802 km and at a speed of about 7 km per second.
Measurement description
Wind measurement accuracy
Measurement principles
Scatterometers such as QuikSCAT emit pulses of low-power microwave radiation and measure the power reflected back to its receiving antenna from the wind-roughened sea surface. Gravity and capillary waves on the sea surface caused by the wind reflect or backscatter power emitted from the scatterometer radar primarily by means of a Bragg resonance condition. The wavelengths of these waves are roughly 1 cm and are usually in equilibrium with the local surface wind. Over water surfaces, the microwave backscatter is highly correlated with the surface wind speed and direction. The particular wavelength of the surface waves is determined by the wavelength of the microwave radiation emitted from the scatterometer's radar.
QuikSCAT consists of an active microwave radar that infers surface winds from the roughness of the sea surface based on measurements of radar backscatter cross section, denoted as σ0. σ0 varies with surface wind speed and direction relative to the antenna azimuth, incidence angle, polarization, and radar frequency. QuikSCAT uses a dual-beam, conically scanning antenna that samples the full range of azimuth angles during each antenna revolution. Backscatter measurements are obtained at fixed incidence angles of 46° and 54°, providing up to four views of each region of the surface at different incidence angles.
Standard processing of the QuikSCAT measurements yields a spatial resolution of about 25 km. A higher spatial resolution of 12.5 km is also achieved through special processing, but has significantly more measurement noise. An even higher spatial resolution of 5 km is also produced, but only for limited regions and special cases.
The σ0 observations are calibrated to the wind speed and direction of the wind at a reference height of 10 meters above the sea surface.
Construction and launch

In 1996, the NASA Scatterometer (NSCAT) was launched aboard the Japanese Advanced Earth Observing Satellite (ADEOS-1). This satellite was designed to record surface winds over water across the world for several years. However, an unexpected failure in 1997 led to an early termination of the NSCAT project. Following this briefly successful mission, NASA began constructing a new satellite to replace the failed one. They planned to build it and have it prepared for launch as soon as possible to limit the gap in data between the two satellites.[5] In just 12 months, the Quick Scatterometer (QuikSCAT) satellite was constructed and ready to be launched, faster than any other NASA mission since the 1950s.[6]
The QuikSCAT project was originally budgeted at $93 million, including the physical satellite, the launch rocket, and ongoing support for its science mission.[7] A series of rocket failures in November 1998 grounded the Titan (rocket family) launcher fleet, delayed the launch of QuikSCAT, and added $5 million to this initial cost.[7]
A new instrument, the SeaWinds scatterometer, was carried on the satellite. The SeaWinds instrument, a specialized microwave radar system, measured both the speed and direction of winds near the ocean surface. It used two radars and a spinning antenna to record data across nine-tenths of the oceans of the world in a single day. It recorded roughly four hundred thousand wind measurements daily, each covering an area 1,800 kilometers (1,100 mi) in width.[6] Jet Propulsion Laboratory and the NSCAT team jointly managed the project of construction of the satellite at the Goddard Space Flight Center. Ball Aerospace & Technologies Corp. supplied the materials to construct the satellite.
In light of the record-setting construction time, engineers who worked on the project were given the American Electronics Achievement Award. This was only achieved due to the new type of contract made specifically for this satellite. Instead of the usual year given to select a contract and initiate development, it was constrained to one month.[8]
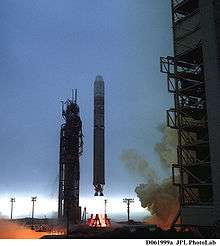
The newly constructed satellite was set to launch on a Titan II rocket from Vandenberg Air Force Base in California. The rocket lifted off at 7:15 pm PDT on 19 June 1999. Roughly two minutes and thirty seconds after launch, the first engine was shut down and the second was engaged as it moved over the Baja California Peninsula. A minute later, the nose cone, at the top of the rocket, separated into two parts. Sixteen seconds later, the rocket was re-oriented to protect the satellite from the sun. For the next 48 minutes, the two crafts flew over Antarctica and later over Madagascar, where the rocket reached its desired altitude of 500 mi (800 km).[9]
At 59 minutes after launch, the satellite separated from the rocket and was pushed into its circular orbit around Earth. Shortly after, the solar arrays were deployed and connection was established with the satellite at 8:32 pm PDT with a tracking station in Norway. For the next two weeks, the shuttle used bursts from its engine to fine-tune its location and correct its course to the desired motion. On July 7, eighteen days after take-off, the scatterometer was turned on and a team of 12 personnel made detailed reviews of function of QuikSCAT. A month after entering orbit, the team completed the checks, and QuikSCAT began collecting and transmitting backscatter measurements.[9]
Applications
Weather Forecasting
Many operational numerical weather prediction centers began assimilating QuikSCAT data in early 2002, with preliminary assessments indicating a positive impact.[10] The U.S. National Centers for Environmental Prediction (NCEP) and the European Centre for Medium-Range Weather Forecasts (ECMWF) led the way by initiating assimilation of QuikSCAT winds beginning, respectively, on 13 January 2002 and 22 January 2002. QuikSCAT surface winds were an important tool for analysis and forecasting at the U.S. National Hurricane Center since becoming available in near–real time in 2000.[11]
QuikSCAT wind fields were also used as a tool in the analysis and forecasting of extratropical cyclones and maritime weather outside the tropics at the U.S. Ocean Prediction Center[12] and the U.S. National Weather Service.[10][13]
Data was also provided in real-time over most of the ice-free global oceans, including traditionally data-sparse regions of the ocean where few observations exist, such as in the Southern Ocean and the eastern tropical Pacific Ocean.
QuikSCAT observations are provided to these operational users in near-real-time (NRT) in binary universal form for the representation of meteorological data (BUFR) format by the National Oceanic and Atmospheric Administration/National Environmental Satellite, Data, and Information Service (NOAA/NESDIS).[14] The data latency goal is 3 hours, and almost all data are available within 3.5 hours of measurement. To meet these requirements, the QuikSCAT NRT data processing algorithms combine the finest-grained backscatter measurements into fewer composites than the science data algorithms. Otherwise the QuikSCAT NRT processing algorithms are identical to the science data algorithms.
Oceanography
Land and Sea Ice

Climate Variability
Tropical Cyclones

Applications of QuikSCAT in operational tropical cyclone analysis and forecasting at the National Hurricane Center include identifying and locating the center of tropical cyclones, estimating its intensity, and wind radii analysis.[2][11] The scatterometer's ability to record wind speeds at the surface allows meteorologists to determine whether a low pressure area is forming and enhance the ability to predict sudden changes in structure and strength.
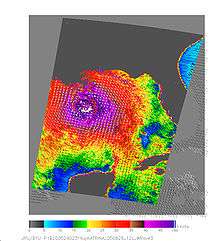
The first tropical cyclone captured by the SeaWinds instrument was Typhoon Olga in the western Pacific basin. The system was monitored by the satellite from its generation on July 28 to its demise in early August.[15]
In 2007, Bill Proenza, the head of the National Hurricane Center at the time, stated in a public message that the loss of the QuikSCAT satellite would harm the quality of hurricane forecasts.[16] This followed a battery anomaly in which the spacecraft was temporarily unable to perform nominal science observations due to limited power.[17] He claimed that three-day forecasts would be roughly 16% less accurate following the loss of QuikSCAT.[18] This position was controversial as it relied on unpublished data.[16] Although the satellite aids in forecasting hurricane position and intensity, it does not do so exclusively.
2009 bearing failure

In mid-2009, a gradual deterioration in the bearings of the antenna's rotation mechanism was noticed. Friction caused by this deterioration slowed the rotation rate of the antenna, leading to gaps in data recorded by QuikSCAT. The antenna ultimately failed on November 23, 2009.[20] Upon failing, it was announced that the satellite was likely at the end of its mission and would no longer be used.[19] The sensor on the satellite was confirmed to have failed around 0700 UTC. The loss only affected the real-time scanning equipment; the long-term data collection remained intact and operational.[18] According to NASA, the failure resulted from the age of the satellite. The mechanism that seized was designed to last only five years; however, it remained operational for roughly ten years, twice its expected use. On November 24, NASA managers began to assess how extensively affected the satellite was and if it was possible to restart the spinning antenna. Contigency plans for what to do in the event of QuikSCAT's failure were also reviewed.[20]
A replacement for this spacecraft, ISS-RapidScat, was launched in 2014.[21]
External links
References
- Draper, David W.; Long, David G. (2004). "Evaluating the effect of rain on Sea Winds scatterometer measurements". Journal of Geophysical Research. 109 (C12): C02005. Bibcode:2004JGRC..109.2005D. doi:10.1029/2002JC001741.
- Said, Faozi; Long, David G. (2011). "Determining Selected Tropical Cyclone Characteristics Using QuikSCAT's Ultra-High Resolution Images". IEEE Journal of Selected Topics in Applied Earth Observations and Remote Sensing. 4 (4): 857–869. Bibcode:2011IJSTA...4..857S. doi:10.1109/JSTARS.2011.2138119.
- Spencer, M.W.; Wu, C.; Long, D.G. (2000). "Improved resolution backscatter measurements with the Sea Winds pencil-beam scatterometer". IEEE Transactions on Geoscience and Remote Sensing. 38 (1): 89–104. Bibcode:2000ITGRS..38...89S. doi:10.1109/36.823904.
- Stiles, B.W.; Yueh, S.H. (2002). "Impact of rain on spaceborne Ku-band wind scatterometer data". IEEE Transactions on Geoscience and Remote Sensing. 40 (9): 1973–1983. Bibcode:2002ITGRS..40.1973S. doi:10.1109/TGRS.2002.803846.
- Staff Writer (June 18, 1998). "NSCAT Paves the Way for Future Ocean Winds Missions". NASA. Archived from the original on February 17, 2013. Retrieved November 24, 2009.
- Staff Writer (June 18, 1998). "SeaWinds Instrument Shipped for QuikSCAT Integration". NASA. Archived from the original on February 17, 2013. Retrieved November 24, 2009.
- Warren E. Leary (June 15, 1999). "Craft to Track Climate-Affecting Link of Sea and Wind". New York Times. Retrieved November 25, 2009.
- Staff Writer (June 4, 1999). "QuikSCAT Team Wins American Electronics Achievement Award". NASA. Archived from the original on February 17, 2013. Retrieved November 24, 2009.
- Staff Writer (June 19, 1999). "NASA's QuikSCAT Ocean Wind Satellite Successfully Launched". NASA. Archived from the original on February 17, 2013. Retrieved November 25, 2009.
- Atlas, R. M., R. N. Hoffman, S. M. Leidner, J. Sienkiewicz, T.-W. Yu, S. C. Bloom, E. Brin, J. Ardizzone, J. Terry, D. Bungato, and J. C. Jusem (2001). <1965:TEOMWF>2.3.CO;2 "The effects of marine winds from scatterometer data on weather analysis and forecasting". Bulletin of the American Meteorological Society. 82 (9): 1965–1990. Bibcode:2001BAMS...82.1965A. doi:10.1175/1520-0477(2001)082<1965:TEOMWF>2.3.CO;2.CS1 maint: multiple names: authors list (link)
- Brennan, Michael J., Christopher C. Hennon, Richard D. Knabb (2009). "The Operational Use of QuikSCAT Ocean Surface Vector Winds at the National Hurricane Center". Weather and Forecasting. 24 (3): 621–645. Bibcode:2009WtFor..24..621B. doi:10.1175/2008WAF2222188.1.CS1 maint: multiple names: authors list (link)
- J. M. Von Ahn; J. M. Sienkiewicz & P. S. Chang (2006). "Operational Impact of QuikSCAT Winds at the NOAA Ocean Prediction Center". Weather and Forecasting. 21 (4): 521–539. Bibcode:2006WtFor..21..523V. doi:10.1175/WAF934.1.
- D. B. Chelton; M. H. Freilich; J. M. Sienkiewicz & J. M. Von Ahn (2006). "On the use of QuikSCAT scatterometer measurements of surface winds for marine weather prediction". Monthly Weather Review. 134 (8): 2055–2071. Bibcode:2006MWRv..134.2055C. doi:10.1175/MWR3179.1.
- Hoffman, R. N., S. Mark Leidner (2005). "An Introduction to the Near–Real–Time QuikSCAT Data". Weather and Forecasting. 20 (4): 476–493. Bibcode:2005WtFor..20..476H. doi:10.1175/WAF841.1.CS1 maint: multiple names: authors list (link)
- Staff Writer (August 9, 1999). "SeaWinds Captures Fury of Typhoon Olga". NASA. Archived from the original on February 17, 2013. Retrieved November 25, 2009.
- Ken Kayes (November 24, 2009). "QuikSCAT satellite dies". Sun Sentinel. Retrieved November 24, 2009.
- Staff Writer (December 5, 2007). "QuikSCAT Data Gaps Due to Battery Anomaly". Physical Oceanography Distributed Active Archive Center. NASA. Archived from the original on 1 June 2013. Retrieved 21 June 2012.
- Eliot Kleinberg (November 23, 2009). "QuikSCAT satellite goes down". The Palm Beach Post. Archived from the original on November 26, 2009. Retrieved November 24, 2009.
- Staff Writer (November 24, 2009). "QuikSCAT satellite ceases operations". CIMSS. Retrieved November 24, 2009.
- Alan Buis (November 24, 2009). "NASA Assessing New Roles for Ailing QuikScat Satellite". NASA. Retrieved November 24, 2009.
- "Scatterometry - Overview".