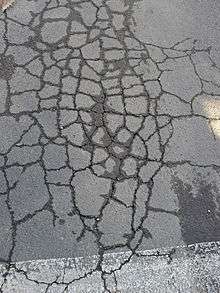
Pavement Condition Index
The Pavement Condition Index (PCI) is a numerical index between 0 and 100, which is used to indicate the general condition of a pavement section. The PCI is widely used in transportation civil engineering[1] and asset management, and many municipalities use it to measure the performance of their road infrastructure and their levels of service.[2] It is a statistical measure and requires manual survey of the pavement. This index was originally developed by the United States Army Corps of Engineers,[3] but later it was standardized by the ASTM.[3][4] The surveying processes and calculation methods have been documented and standardized by ASTM for both roads and airport pavements:
- ASTM D6433 - 11: Standard Practice for Roads and Parking Lots Pavement Condition Index Surveys
- ASTM D5340 - 12: Standard Test Method for Airport Pavement Condition Index Surveys
PCI calculation

The method is based on a visual survey of the number and types of distresses in a pavement. First, the type and extent of existing distresses, their severity level is collected. Next, distress density is calculated for each type of distress. The density values are translated into deduct value (DV) and corrected deduct value (CDV) using a set of curves proposed by the ASTM. The ASTM does not include the formulae of these curves, but they are recalculated by researchers.[1][4] Finally, the value of the PCI is calculated in an iterative process. The result of the analysis is a numerical value between 0 and 100, with 100 representing the best possible condition and 0 representing the worst possible condition.
Pavement distress types for asphalt pavements include:
- Alligator cracking
- Bleeding
- Block cracking
- Bumps and sags
- Corrugations
- Depressions
- Edge cracking
- Joint reflections
- Lane/shoulder drop-off
- Longitudinal and transverse cracking
- Low ride quality
- Patching and utility cut patching
- Polished aggregate
- Potholes
- Rutting
- Shoving
- Slippage cracking
- Swelling
- Weathering and raveling
For relatively small pavement systems, the entire system may be surveyed. For large pavement systems, the process may involve surveying a random or representative sample of the entire system with the following steps:
- Divide the total pavement section into sample units (approximately 5000 square feet).
- Based on the number of sample units in the total section, a certain number of these units are selected to be tested. For example, if there are 40 or more sample units, 10% are tested.
- The type, extent and severity of pavement distress in each section are recorded using the ASTM Standard D 5340 method.
- The PCI of each tested sample unit is calculated using the method defined in the standard. In summary this involves calculating the distress quantities and the distress densities for each tested unit. These values are used to determine a deduct value and this deduct value is subtracted from 100 to give the PCI value.
- If the surveyed samples are representative of the overall system, the PCI of the pavement system is then assumed to be equal to the PCI of the sampled areas.
This condition index can give a good indication of the pavement condition of a network.[5] However, trained personnel are required to complete the complicated survey procedure.[6]
PCI categorization
The ASTM divides the PCI into seven classes as follows, but in practice a PCI lower than 40 is almost impassable.[4][7]
| PCI range | Class |
|---|---|
| 85-100 | Good |
| 70-85 | Satisfactory |
| 55-70 | Fair |
| 40-55 | Poor |
| 25-40 | Very Poor |
| 10-25 | Serious |
| 0-10 | Failed |
See also
- Pavement classification number
- International Roughness Index
- AASHTO Road Test
References
- Piryonesi, S. M.; El-Diraby, T. (2018). "Using Data Analytics for Cost-Effective Prediction of Road Conditions: Case of The Pavement Condition Index:[summary report]". United States. Federal Highway Administration. Office of Research, Development, and Technology. FHWA-HRT-18-065. Archived from the original on 2019-02-02 – via National Transportation Library Repository & Open Science Access Portal.
- "Piryonesi, S. M. (2019). The Application of Data Analytics to Asset Management: Deterioration and Climate Change Adaptation in Ontario Roads (Doctoral dissertation)".
- "Development Of A Pavement Condition Index For Roads And Streets". Tris Online Record. Research and Innovative Technology Administration (RITA), National Transportation Library. Archived from the original on 2012-02-08.
- Piryonesi, S. M.; El-Diraby, T. E. (2020) [Published online: December 21, 2019]. "Data Analytics in Asset Management: Cost-Effective Prediction of the Pavement Condition Index". Journal of Infrastructure Systems. 26 (1): 04019036. doi:10.1061/(ASCE)IS.1943-555X.0000512.
- Yardley, William (Jan 26, 2008). "Building Costs Deal Blow to Local Budgets". New York Times.
- "Main Menu (List of Modules)". Washington State DOT pavement guide. Archived from the original on 2010-02-11. Retrieved 2010-06-19.
- Bryce, J.; Boadi, R.; Groeger, J. (2019). "Relating Pavement Condition Index and Present Serviceability Rating for Asphalt-Surfaced Pavements". Transportation Research Record: Journal of the Transportation Research Board. 2673 (3): 308–312. doi:10.1177/0361198119833671.