Musselshell County, Montana
Musselshell County is a county in south-central Montana. As of the 2010 United States Census, the population was 4,538.[3] Its county seat is Roundup.[4]
Musselshell County | |
|---|---|
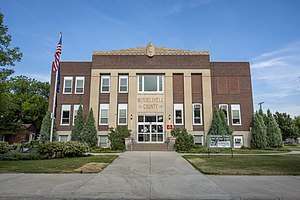
 The Musselshell County Courthouse in Roundup | |
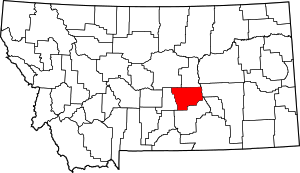
 Location within the U.S. state of Montana | |
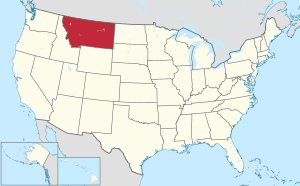
 Montana's location within the U.S. | |
| Coordinates: 46°29′N 108°24′W | |
| Country | |
| State | |
| Founded | February 2, 1911[1] |
| Seat | Roundup |
| Largest city | Roundup |
| Area | |
| • Total | 1,871 sq mi (4,850 km2) |
| • Land | 1,868 sq mi (4,840 km2) |
| • Water | 2.8 sq mi (7 km2) 0.1% |
| Population (2010) | |
| • Total | 4,538 |
| • Estimate (2018) | 4,651 |
| • Density | 2.4/sq mi (0.94/km2) |
| Time zone | UTC−7 (Mountain) |
| • Summer (DST) | UTC−6 (MDT) |
| Congressional district | At-large |
| Website | musselshellcounty |
| |
History
Musselshell County was created in 1911 by Montana Governor Edwin L. Norris. The area was taken from Fergus, from Yellowstone, and Meagher counties. It was named for the Musselshell River which runs southwest-northeast through the county. That river had been thus named in 1805 by the Lewis and Clark Expedition, due to the abundance of freshwater mussels found along its banks. In 1915, a western portion of the county was partitioned off to form Golden Valley County, giving Musselshell County its present boundaries.
The county's northwestern area is rolling grasslands, which slope southeastward to the Musselshell River and the forested Bull Mountains in the southeast. The county has abundant natural resources of coal deposits, subterranean oil, and timbered slopes.[1]
Geography
According to the US Census Bureau, the county has a total area of 1,863.91 square miles (4,827.5 km2), of which 1,861.16 square miles (4,820.4 km2) is land and 2.75 square miles (7.1 km2) (0.1%) is water.[5]
Major highways


Adjacent counties
- Fergus County - northwest
- Petroleum County - north
- Rosebud County - east
- Yellowstone County - south
- Golden Valley County - west
National protected area
Politics
In the fourteen national elections after its organization, Musselshell County voters selected Republican presidential candidates 50% of the time, and Democratic candidates 50% of the time. However, since the 1968 election, the Republican candidate has been selected in every election.
| Year | Republican | Democratic | Third parties |
|---|---|---|---|
| 2016 | 80.6% 1,967 | 13.6% 332 | 5.8% 142 |
| 2012 | 76.2% 1,833 | 20.4% 492 | 3.4% 82 |
| 2008 | 68.6% 1,581 | 27.6% 636 | 3.9% 89 |
| 2004 | 74.0% 1,663 | 23.9% 538 | 2.1% 46 |
| 2000 | 71.7% 1,582 | 23.2% 512 | 5.1% 113 |
| 1996 | 54.0% 1,121 | 31.4% 652 | 14.6% 303 |
| 1992 | 39.3% 876 | 29.1% 648 | 31.6% 704 |
| 1988 | 58.1% 1,280 | 40.7% 898 | 1.2% 26 |
| 1984 | 65.3% 1,541 | 33.1% 781 | 1.6% 37 |
| 1980 | 58.0% 1,279 | 35.6% 784 | 6.4% 141 |
| 1976 | 54.1% 1,117 | 44.7% 922 | 1.3% 26 |
| 1972 | 61.1% 1,202 | 35.0% 689 | 3.9% 76 |
| 1968 | 51.2% 953 | 42.7% 795 | 6.2% 115 |
| 1964 | 40.9% 823 | 59.1% 1,189 | 0.0% 0 |
| 1960 | 50.1% 1,107 | 49.8% 1,100 | 0.1% 3 |
| 1956 | 51.1% 1,165 | 48.9% 1,115 | 0.0% 0 |
| 1952 | 50.1% 1,253 | 49.6% 1,240 | 0.4% 9 |
| 1948 | 40.5% 1,010 | 47.6% 1,188 | 11.9% 298 |
| 1944 | 42.3% 1,004 | 56.5% 1,342 | 1.2% 29 |
| 1940 | 36.8% 1,086 | 61.2% 1,807 | 2.0% 59 |
| 1936 | 25.6% 771 | 69.4% 2,092 | 5.0% 151 |
| 1932 | 36.0% 1,021 | 55.8% 1,584 | 8.3% 235 |
| 1928 | 50.6% 1,608 | 45.4% 1,444 | 4.1% 129 |
| 1924 | 45.6% 1,488 | 7.6% 247 | 46.9% 1,532 |
| 1920 | 59.2% 1,910 | 29.5% 951 | 11.3% 364 |
| 1916 | 42.9% 1,738 | 50.3% 2,036 | 6.8% 275 |
| 1912 | 30.8% 483 | 30.0% 470 | 39.2% 615[7] |
Demographics
| Historical population | |||
|---|---|---|---|
| Census | Pop. | %± | |
| 1920 | 12,030 | — | |
| 1930 | 7,242 | −39.8% | |
| 1940 | 5,717 | −21.1% | |
| 1950 | 5,408 | −5.4% | |
| 1960 | 4,888 | −9.6% | |
| 1970 | 3,734 | −23.6% | |
| 1980 | 4,428 | 18.6% | |
| 1990 | 4,106 | −7.3% | |
| 2000 | 4,497 | 9.5% | |
| 2010 | 4,538 | 0.9% | |
| Est. 2018 | 4,651 | [8] | 2.5% |
| US Decennial Census[9] 1790-1960[10] 1900-1990[11] 1990-2000[12] 2010-2018[3] | |||
2000 census
As of the 2000 United States Census[13] there were 4,497 people, 1,878 households, and 1,235 families in the county. The population density was 2 people per square mile (1/km²). There were 2,317 housing units at an average density of <1/km² (1/sq mi). The racial makeup of the county was 96.91% White, 0.07% Black or African American, 1.27% Native American, 0.16% Asian, 0.04% Pacific Islander, 0.38% from other races, and 1.18% from two or more races. 1.60% of the population were Hispanic or Latino of any race. 26.6% were of German, 14.8% English, 8.4% Norwegian, 8.1% Irish and 7.4% American ancestry. 96.5% spoke English and 2.6% German as their first language.
There were 1,878 households out of which 27.20% had children under the age of 18 living with them, 55.60% were married couples living together, 6.60% had a female householder with no husband present, and 34.20% were non-families. 30.10% of all households were made up of individuals and 13.80% had someone living alone who was 65 years of age or older. The average household size was 2.33, and the average family size was 2.91.
The county population contained 23.40% under the age of 18, 5.70% from 18 to 24, 24.00% from 25 to 44, 29.40% from 45 to 64, and 17.50% who were 65 years of age or older. The median age was 43 years. For every 100 females there were 95.40 males. For every 100 females age 18 and over, there were 95.70 males.
The median income for a household in the county was $25,527, and the median income for a family was $32,298. Males had a median income of $25,000 versus $17,813 for females. The per capita income for the county was $15,389. 19.90% of the population and 13.00% of families were below the poverty line. Out of the total population, 31.70% of those under the age of 18 and 10.50% of those 65 and older were living below the poverty line.
2010 census
As of the 2010 United States Census, there were 4,538 people, 2,046 households, and 1,276 families in the county.[14] The population density was 2.4 inhabitants per square mile (0.93/km2). There were 2,654 housing units at an average density of 1.4 per square mile (0.54/km2).[15] The racial makeup of the county was 96.1% white, 1.3% American Indian, 0.2% black or African American, 0.2% Asian, 0.2% from other races, and 1.9% from two or more races. Those of Hispanic or Latino origin made up 2.6% of the population.[14] In terms of ancestry, 28.1% were German, 16.5% were English, 16.1% were Irish, 7.6% were Norwegian, and 7.0% were American.[16]
Of the 2,046 households, 23.2% had children under the age of 18 living with them, 52.4% were married couples living together, 6.5% had a female householder with no husband present, 37.6% were non-families, and 33.5% of all households were made up of individuals. The average household size was 2.19 and the average family size was 2.78. The median age was 49.1 years.[14]
The median income for a household in the county was $37,033 and the median income for a family was $47,860. Males had a median income of $33,182 versus $25,750 for females. The per capita income for the county was $20,875. About 14.1% of families and 17.8% of the population were below the poverty line, including 28.6% of those under age 18 and 9.6% of those age 65 or over.[17]
Communities
City
- Roundup (county seat)
Town
Census-designated places
See also
- List of cemeteries in Musselshell County, Montana
- List of lakes in Musselshell County, Montana
- List of mountains in Musselshell County, Montana
- National Register of Historic Places listings in Musselshell County, Montana
References
- About Musselshell County
- The NaCo site lists county area as 1,871 sq. miles; the Census Bureau site lists 1,867.15; the Musselshell County website shows 1,965.
- "State & County QuickFacts". US Census Bureau. Archived from the original on June 6, 2011. Retrieved September 15, 2013.
- "Find a County". National Association of Counties. Retrieved June 7, 2011.
- "2010 Census Gazetteer Files". US Census Bureau. August 22, 2012. Archived from the original on December 5, 2014. Retrieved January 4, 2019.
- Leip, David. "Atlas of US Presidential Elections". uselectionatlas.org. Retrieved April 3, 2018.
- The leading "other" candidate, Progressive Theodore Roosevelt, received 400 votes, while Socialist candidate Eugene Debs received 215 votes.
- "Population and Housing Unit Estimates". Retrieved August 5, 2019.
- "US Decennial Census". US Census Bureau. Retrieved November 29, 2014.
- "Historical Census Browser". University of Virginia Library. Retrieved November 29, 2014.
- "Population of Counties by Decennial Census: 1900 to 1990". US Census Bureau. Retrieved November 29, 2014.
- "Census 2000 PHC-T-4. Ranking Tables for Counties: 1990 and 2000" (PDF). US Census Bureau. Retrieved November 29, 2014.
- "U.S. Census website". US Census Bureau. Retrieved January 31, 2008.
- "Profile of General Population and Housing Characteristics: 2010 Demographic Profile Data". US Census Bureau. Archived from the original on February 13, 2020. Retrieved January 10, 2016.
- "Population, Housing Units, Area, and Density: 2010 - County". US Census Bureau. Archived from the original on February 13, 2020. Retrieved January 10, 2016.
- "Selected Social Characteristics in the US – 2006-2010 American Community Survey 5-Year Estimates". US Census Bureau. Archived from the original on February 13, 2020. Retrieved January 10, 2016.
- "Selected Economic Characteristics – 2006-2010 American Community Survey 5-Year Estimates". US Census Bureau. Archived from the original on February 13, 2020. Retrieved January 10, 2016.
- Delphia MT Google Maps (accessed 4 January 2019)
- Elso, MT Google Maps (accessed 4 January 2019)
- Queens Point MT Google Maps (accessed 4 January 2019)
