Mississippi's 2nd congressional district
Mississippi's 2nd congressional district (MS-2) covers much of Western Mississippi. It includes most of Jackson, the riverfront cities of Greenville and Vicksburg and the interior market cities of Clarksdale, Greenwood and Clinton. The district is approximately 275 miles (443 km) long, 180 miles (290 km) wide and borders the Mississippi River; it encompasses much of the Mississippi Delta, and a total of 15 counties and parts of several others. It is the only majority-black district in the state.
| Mississippi's 2nd congressional district | |||
|---|---|---|---|
.tif.png) Mississippi's 2nd congressional district since January 3, 2013 | |||
| Representative |
| ||
| Area | 14,519.68 sq mi (37,605.8 km2) | ||
| Distribution |
| ||
| Population (2006) | 711,164 | ||
| Median income | $35,842[1] | ||
| Ethnicity |
| ||
| Cook PVI | D+14[2] | ||
The district is home to four of Mississippi's eight public four-year colleges and universities: Alcorn State University in Lorman; Delta State University in Cleveland; Jackson State University in Jackson; and Mississippi Valley State University in Itta Bena, a few miles west of Greenwood. All except Delta State are HBCUs and are members of the Southwestern Athletic Conference.
From statehood to the election of 1846, Mississippi elected representatives at-large statewide on a general ticket. This favored candidates who could command a majority of the voters, then consisting mostly of white men of property.
Following Reconstruction, the Democratic Party regained control of the state legislature and worked to reduce Republican voting strength in the state. It redefined congressional districts, creating a 'shoestring' congressional district running the length of the Mississippi River and taking in the black-majority (then Republican) areas of the Mississippi Delta. By this gerrymandering, they created five other districts with white majorities.[3]
Election campaigns were often accompanied by fraud and violence as Democrats tried to reduce black Republican voting. Finally, the Democratic-dominated legislature passed a new constitution in 1890, with barriers to voter registration and other measures that effectively disenfranchised most blacks and many poor whites for decades, subduing the Republican and Populist movements of the late 19th century.[4]
The legislature has redefined congressional districts over the years to reflect population changes in the state. Districts 5 through 8 were reallocated to the 1st, 3rd and 4th. The 2nd, bounded by the Mississippi River on the west, continues to have a black-majority population. Since the passage of the Civil Rights Act of 1964 and Voting Rights Act of 1965, which provided federal oversight and enforcement to protect voting, African-American residents here have consistently supported Democratic party candidates. On the other hand, most white conservatives have shifted into the Republican Party, which would eventually dominate the legislature. The district is one of the poorest in the state,[5] with 26.2% of people in poverty as of 2017.[6]
The district's current Representative is Democrat Bennie Thompson.
Recent election results
2000
| Party | Candidate | Votes | % | ± | |
|---|---|---|---|---|---|
| Democratic | Bennie Thompson (Incumbent) | 112,777 | 65.07 | ||
| Republican | Hardy Caraway | 54,090 | 31.21 | ||
| Libertarian | William G. Chipman | 4,305 | 2.48 | ||
| Reform | Lee F. Dilworth | 2,135 | 1.23 | ||
| Turnout | 173,307 | ||||
| Majority | 58,687 | 33.86 | |||
2002
| Party | Candidate | Votes | % | ± | |
|---|---|---|---|---|---|
| Democratic | Bennie Thompson (Incumbent) | 89,913 | 55.14 | -9.93 | |
| Republican | Clinton B. LeSueur | 69,711 | 42.75 | +11.54 | |
| Reform | Lee F. Dilworth | 3,426 | 2.10 | +0.87 | |
| Turnout | 163,050 | ||||
| Majority | 20,202 | 12.39 | |||
2004
| Party | Candidate | Votes | % | ± | |
|---|---|---|---|---|---|
| Democratic | Bennie Thompson (Incumbent) | 154,626 | 58.38 | +3.24 | |
| Republican | Clinton B. LeSueur | 107,647 | 40.64 | -2.11 | |
| Reform | Shawn O'Hara | 2,596 | 0.98 | -1.12 | |
| Turnout | 264,869 | ||||
| Majority | 46,979 | 17.74 | |||
2006
| Party | Candidate | Votes | % | ± | |
|---|---|---|---|---|---|
| Democratic | Bennie Thompson (Incumbent) | 100,168 | 64.27 | +5.89 | |
| Republican | Yvonne R. Brown | 55,672 | 35.73 | -4.91 | |
| Turnout | 155,832 | ||||
| Majority | 44,496 | 28.55 | |||
2008
| Party | Candidate | Votes | % | ± | |
|---|---|---|---|---|---|
| Democratic | Bennie Thompson (Incumbent) | 201,606 | 69.05 | +4.78 | |
| Republican | Richard Cook | 90,364 | 30.95 | -4.78 | |
| Turnout | 291,970 | ||||
| Majority | 111,242 | 38.10 | |||
2010
| Party | Candidate | Votes | % | |
|---|---|---|---|---|
| Democratic | Bennie Thompson (Incumbent) | 105,327 | 61.47 | |
| Republican | Bill Marcy | 64,499 | 37.64 | |
| Reform | Ashley Norwood | 1,530 | 0.89 | |
| Total votes | 171,356 | 100.00 | ||
| Democratic hold | ||||
2012
| Party | Candidate | Votes | % | |
|---|---|---|---|---|
| Democratic | Bennie Thompson (Incumbent) | 214,978 | 67.13 | |
| Republican | Bill Marcy | 99,160 | 30.96 | |
| Independent | Cobby Williams | 4,605 | 1.44 | |
| Reform | Lajena Williams | 1,501 | 0.47 | |
| Total votes | 320,244 | 100.00 | ||
| Democratic hold | ||||
2014
| Party | Candidate | Votes | % | |
|---|---|---|---|---|
| Democratic | Bennie Thompson (Incumbent) | 100,688 | 67.7 | |
| Independent | Troy Ray | 36,465 | 24.5 | |
| Reform | Shelley Shoemake | 11,493 | 7.7 | |
| Total votes | 148,646 | 100.00 | ||
| Democratic hold | ||||
2016
| Party | Candidate | Votes | % | |
|---|---|---|---|---|
| Democratic | Bennie Thompson (Incumbent) | 192,343 | 67.1 | |
| Republican | John Bouie II | 83,542 | 29.1 | |
| Independent | Troy Ray | 6,918 | 2.4 | |
| Reform | Johnny McLeod | 3,823 | 1.3 | |
| Total votes | 286,626 | 100.00 | ||
| Democratic hold | ||||
2018
| Party | Candidate | Votes | % | |
|---|---|---|---|---|
| Democratic | Bennie Thompson (Incumbent) | 158,921 | 71.8 | |
| Independent | Troy Ray | 48,104 | 21.7 | |
| Reform | Irving Harris | 14,354 | 6.5 | |
| Total votes | 221,379 | 100.00 | ||
| Democratic hold | ||||
List of members representing the district
| Name | Party | Years of Service | Cong ress |
Electoral history |
|---|---|---|---|---|
| District created March 4, 1847 | ||||
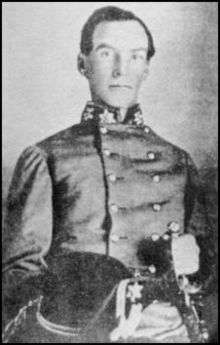 Winfield S. Featherston |
Democratic | March 4, 1847 – March 3, 1851 |
30th 31st |
[data unknown/missing] |
| John A. Wilcox | Unionist | March 4, 1851 – March 3, 1853 |
32nd | [data unknown/missing] |
| William T. S. Barry | Democratic | March 4, 1853 – March 3, 1855 |
33rd | [data unknown/missing] |
| Hendley S. Bennett | Democratic | March 4, 1855 – March 3, 1857 |
34th | [data unknown/missing] |
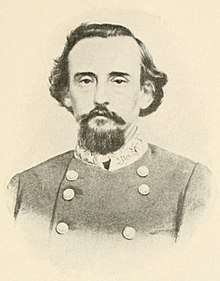
 Reuben Davis |
Democratic | March 4, 1857 – January 12, 1861 |
35th 36th |
[data unknown/missing] Withdrew. |
| Vacant | January 12, 1861 – February 23, 1870 |
36th 37th 38th 39th 40th 41st |
Civil War and Reconstruction | |
 Joseph L. Morphis |
Republican | February 23, 1870 – March 3, 1873 |
41st 42nd |
Elected in 1869 to finish the term and to the next term. [data unknown/missing] |
| Albert R. Howe | Republican | March 4, 1873 – March 3, 1875 |
43rd | [data unknown/missing] |
 G. Wiley Wells |
Independent Republican | March 4, 1875 – March 3, 1877 |
44th | [data unknown/missing] |
 Van H. Manning |
Democratic | March 4, 1877 – March 3, 1883 |
45th 46th 47th |
[data unknown/missing] |
| Vacant | March 4, 1883 – June 25, 1884 |
48th | ||
 James R. Chalmers |
Independent | June 25, 1884 – March 3, 1885 |
Seated after contested election with Van H. Manning. | |
| James B. Morgan | Democratic | March 4, 1885 – March 3, 1891 |
49th 50th 51st |
[data unknown/missing] |
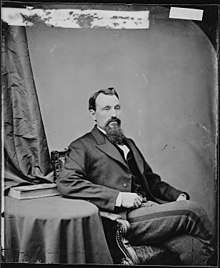
.jpg) John C. Kyle |
Democratic | March 4, 1891 – March 3, 1897 |
52nd 53rd 54th |
[data unknown/missing] |
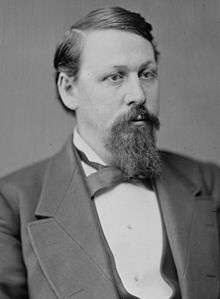
 William V. Sullivan |
Democratic | March 4, 1897 – May 31, 1898 |
55th | [data unknown/missing] Resigned when appointed U.S. Senator. |
| Vacant | May 31, 1898 – July 5, 1898 | |||
 Thomas Spight |
Democratic | July 5, 1898 – March 3, 1911 |
55th 56th 57th 58th 59th 60th 61st |
[data unknown/missing] |
 Hubert D. Stephens |
Democratic | March 4, 1911 – March 3, 1921 |
62nd 63rd 64th 65th 66th |
[data unknown/missing] |
.jpg) Bill G. Lowrey |
Democratic | March 4, 1921 – March 3, 1929 |
67th 68th 69th 70th |
[data unknown/missing] |
.jpg) Wall Doxey |
Democratic | March 4, 1929 – September 28, 1941 |
71st 72nd 73rd 74th 75th 76th 77th |
[data unknown/missing] Resigned when elected U.S. Senator. |
| Vacant | September 28, 1941 – November 4, 1941 |
77th | ||
 Jamie Whitten |
Democratic | November 4, 1941 – January 3, 1973 |
77th 78th 79th 80th 81st 82nd 83rd 84th 85th 86th 87th 88th 89th 90th 91st 92nd |
[data unknown/missing] Redistricted to the 1st district. |
 David R. Bowen |
Democratic | January 3, 1973 – January 3, 1983 |
93rd 94th 95th 96th 97th |
[data unknown/missing] |
 Webb Franklin |
Republican | January 3, 1983 – January 3, 1987 |
98th 99th |
[data unknown/missing] |
 Mike Espy |
Democratic | January 3, 1987 – January 22, 1993 |
100th 101st 102nd 103rd |
[data unknown/missing] Resigned to become U.S. Secretary of Agriculture |
| Vacant | January 22, 1993 – April 13, 1993 |
103rd | ||
 Bennie Thompson |
Democratic | April 13, 1993 – present |
103rd 104th 105th 106th 107th 108th 109th 110th 111th 112th 113th 114th 115th 116th |
Elected to finish Espy's term. |
Historical district boundaries
References
- https://www.census.gov/mycd/?st=28&cd=02
- "Partisan Voting Index – Districts of the 115th Congress" (PDF). The Cook Political Report. April 7, 2017. Retrieved April 7, 2017.
- Eric Foner, Reconstruction, 1863-1877, New York: Perennial Classics, p. 590.
- Michael Perman, Struggle for Mastery: Disfranchisement in the South, 1888-1908 (2000), ch 4.
- "Rich, poor, young, old: Congressional districts at a glance | Bloomberg Government". Bloomberg Government. 2017-09-15. Retrieved 2018-11-21.
- "datatables". www.frac.org. Retrieved 2018-11-21.
- Martis, Kenneth C. (1989). The Historical Atlas of Political Parties in the United States Congress. New York: Macmillan Publishing Company.
- Martis, Kenneth C. (1982). The Historical Atlas of United States Congressional Districts. New York: Macmillan Publishing Company.
- Congressional Biographical Directory of the United States 1774–present