Minto (electoral district)
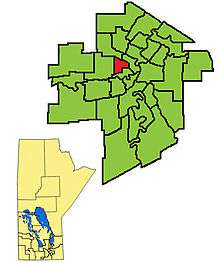
Minto was a provincial electoral division in the Canadian province of Manitoba. It was created by redistribution in 1999, and has formally existed since the provincial election of 1999. The riding is located in the centre of the City of Winnipeg.
 | |
| Defunct provincial electoral district | |
| Legislature | Legislative Assembly of Manitoba |
| District created | 1998 |
| First contested | 1999 |
| Last contested | 2016 |
Minto was created primarily from territory from the old St. James riding, with some additional territory from Wellington as well. In many respects, the riding may be regarded as a successor to the St. James riding which existed before 1999.
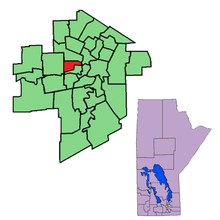
Minto was bordered on the east by Point Douglas, to the north by Wellington, to the south by Wolseley, and to the west by the current St. James riding.
The riding's population in 1996 was 20,479. In 1999, the average family income was $37,037, and the unemployment rate was 13.80%. Thirty-seven per cent of the riding's residents are listed as low-income, one of the highest rates in the province. Twenty-two per cent of families in the riding are single-parent.
Minto has an immigrant population of 33%, the highest in the province. Sixteen per cent of the riding's residents are Filipino, 7% Portuguese, 3% Chinese and 2% Italian. The aboriginal population in the riding is 14%.
Manufacturing accounts for 25% of Minto's industry, with a further 19% in the service sector.
List of provincial representatives
| Parliament | Years | Member | Party | |
|---|---|---|---|---|
| 37th | 1999–2003 | MaryAnn Mihychuk | New Democratic | |
| 38th | 2003–2004 | |||
| 2004–2007 | Andrew Swan | |||
| 39th | 2007–2011 | |||
| 40th | 2011–2016 | |||
| 41st | 2016–2019 | |||
Electoral results
| 2016 Manitoba general election | ||||||||
|---|---|---|---|---|---|---|---|---|
| Party | Candidate | Votes | % | ±% | Expenditures | |||
| New Democratic | Andrew Swan | 2,954 | 51.70 | -14.30 | $26,466.03 | |||
| Progressive Conservative | Belinda Squance | 1,016 | 17.78 | +2.57 | $12,274.18 | |||
| Liberal | Demetre Balaktsis | 723 | 12.65 | +1.53 | $12,454.78 | |||
| Independent | Don Woodstock | 589 | 10.31 | (-0.81) | $4,461.80 | |||
| Green | Martha Jo Willard | 410 | 7.16 | +1.08 | $675.67 | |||
| Manitoba | Virgil Gil | 51 | 0.89 | $60.54 | ||||
| Communist | Andrew Taylor | 41 | 0.71 | -0.31 | $33.67 | |||
| Total valid votes/Expense limit | 5,784 | 100.0 | $36,670.00 | |||||
| Eligible voters | 10,729 | |||||||
| Source: Elections Manitoba[1][2] | ||||||||
| 2011 Manitoba general election | ||||||||
|---|---|---|---|---|---|---|---|---|
| Party | Candidate | Votes | % | ±% | Expenditures | |||
| New Democratic | Andrew Swan | 3,615 | 66.00 | +3.18 | 18,232.83 | |||
| Progressive Conservative | Belinda Squance | 833 | 15.21 | +2.89 | 6,812.15 | |||
| Liberal | Don Woodstock | 609 | 11.12 | −10.56 | 10,634.00 | |||
| Green | Harold Dyck | 331 | 6.08 | – | 1,260.81 | |||
| Communist | Cheryl-Anne Carr | 56 | 1.02 | −0.89 | 387.11 | |||
| Total valid votes | 5,444 | |||||||
| Rejected and declined votes | 33 | |||||||
| Turnout | 5,477 | 46.43 | ||||||
| Electors on the lists | 11,796 | |||||||
| Source: Elections Manitoba[3] | ||||||||
| 2007 Manitoba general election | ||||||||
|---|---|---|---|---|---|---|---|---|
| Party | Candidate | Votes | % | ±% | Expenditures | |||
| New Democratic | Andrew Swan | 3,355 | 62.82% | +8.13 | $22,471.08 | |||
| Liberal | Wayne Helgason | 1,158 | 21.68% | −9.35 | $22,178.53 | |||
| Progressive Conservative | Kenny Daodu | 658 | 12.32% | +0.20 | $10,160.91 | |||
| Communist | Cheryl-Anne Carr | 102 | 1.91% | −0.26 | $373.87 | |||
| Total valid votes | 5,273 | 98.73% | ||||||
| Rejected and declined votes | 68 | |||||||
| Turnout | 5,341 | 50.38 | ||||||
| Electors on the lists | 10,601 | |||||||
| Manitoba provincial by-election, June 22, 2004 | ||||||||
|---|---|---|---|---|---|---|---|---|
| Party | Candidate | Votes | % | Expenditures | ||||
| New Democratic | Andrew Swan | 2,848 | 54.69 | $14,208.77 | ||||
| Liberal | Wayne Helgason | 1,616 | 31.03 | $9,826.24 | ||||
| Progressive Conservative | David Laurence | 631 | 12.12 | $41.20 | ||||
| Communist | Cheryl-Anne Carr | 113 | 2.17 | $0.00 | ||||
| Total valid votes | 5,208 | 100.00 | ||||||
| Rejected ballots | 43 | |||||||
| Turnout | 5,251 | 47.18 | ||||||
| Registered voters | 11,129 | |||||||
| 2003 Manitoba general election | ||||||||
|---|---|---|---|---|---|---|---|---|
| Party | Candidate | Votes | % | ±% | Expenditures | |||
| New Democratic | MaryAnn Mihychuk | 3,586 | 69.47 | +5.55 | $11,337.04 | |||
| Liberal | Mario Javier | 685 | 13.27 | +6.90 | $5,174.30 | |||
| Progressive Conservative | David Laurence | 626 | 12.13 | -16.56 | $439.06 | |||
| Green | Joan Johannson | 197 | 3.82 | $544.46 | ||||
| Communist | Cheryl-Anne Carr | 68 | 1.32 | +0.69 | $376.06 | |||
| Total valid votes | 5,162 | 100.00 | ||||||
| Rejected and declined ballots | 66 | |||||||
| Turnout | 5,228 | 47.25 | ||||||
| Electors on the lists | 11,064 | |||||||
| 1999 Manitoba general election | ||||||||
|---|---|---|---|---|---|---|---|---|
| Party | Candidate | Votes | % | Expenditures | ||||
| New Democratic | MaryAnn Mihychuk | 4,534 | 63.92 | $23,618.00 | ||||
| Progressive Conservative | Harry Lehotsky | 2,035 | 28.69 | $18,962.44 | ||||
| Liberal | Duane Poettcker | 452 | 6.37 | $629.69 | ||||
| Communist | Harold Dyck | 45 | 0.63 | $0.00 | ||||
| Libertarian | Didz Zuzens | 27 | 0.38 | $270.76 | ||||
| Total valid votes | 7,093 | |||||||
| Rejected and declined votes | 63 | |||||||
| Turnout | 7,156 | 64.08 | ||||||
| Electors on the lists | 11,168 | |||||||
Previous boundaries
References
- "Candidates: 41st General Election". Elections Manitoba. 29 March 2016. Retrieved 31 March 2016.
- "Election Returns: 41st General Election". Elections Manitoba. 2016. Retrieved 27 August 2018.
- "Election Returns: 40th General Election". Elections Manitoba. 2011. Retrieved 27 August 2018.
- "Archived copy". Archived from the original on 2012-03-21. Retrieved 2010-11-23.CS1 maint: archived copy as title (link)
- "Archived copy". Archived from the original on 2011-07-17. Retrieved 2010-08-09.CS1 maint: archived copy as title (link) – 1999 Results