Burrows (electoral district)
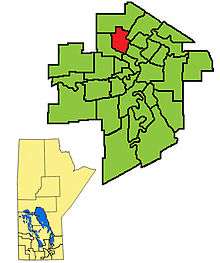
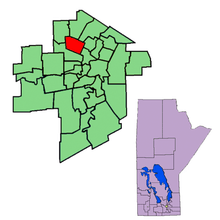
Burrows is a provincial electoral division in the Canadian province of Manitoba. It was created by redistribution in 1957 from part of Winnipeg North, and formally came into existence in the provincial election of 1958. The riding is located in the northern part of Winnipeg.
 | |||
| Provincial electoral district | |||
| Legislature | Legislative Assembly of Manitoba | ||
| MLA |
New Democratic | ||
| District created | 1957 | ||
| First contested | 1958 | ||
| Last contested | 2019 | ||
Burrows is named after Theodore Arthur Burrows, who served as Lieutenant-Governor of Manitoba from 1926 to 1929. It is bordered to the east by St. Johns and Point Douglas, to the south by Wellington, to the north by Kildonan and The Maples, and to the west by Tyndall Park. The riding's boundaries were significantly redrawn in 1999, taking in a considerable amount of territory which was previously a part of the now-defunct Inkster.
The riding's population in 1996 was 18,718. In 1999, the average family income was $35,575, one of the lowest rates in the province. Thirty-nine per cent of the riding's residents are listed as low-income, with an unemployment rate of 13%. One household in four has only one parent. Nineteen per cent of the riding's residents are over sixty-five years of age.
The total immigrant population in Burrows is 21%, with almost one in three residents speaking a first language other than English or French. The Aboriginal population is 15%.
Manufacturing accounts for 22% of Burrows' industry, with a further 15% in the service sector.
The CCF and its successor the NDP have won Burrows on all but three occasions since the riding was created, with the Liberals winning the other three elections.
List of provincial representatives
| Name | Party | Took Office | Left Office |
|---|---|---|---|
| John Hawryluk | CCF | 1958 | 1961 |
| NDP | 1961 | 1962 | |
| Mark Smerchanski | Lib | 1962 | 1966 |
| Ben Hanuschak | NDP | 1966 | 1981 |
| Independent | 1981 | 1981 | |
| Prog | 1981 | 1981 | |
| Conrad Santos | NDP | 1981 | 1988 |
| William Chornopyski | Lib | 1988 | 1990 |
| Doug Martindale | NDP | 1990 | 2011 |
| Melanie Wight | NDP | 2011 | 2016 |
| Cindy Lamoureux | Lib | 2016 | 2019 |
| Diljeet Brar | NDP | 2019 |
Electoral results
| 2019 Manitoba general election | ||||||||
|---|---|---|---|---|---|---|---|---|
| Party | Candidate | Votes | % | ±% | ||||
| New Democratic | Diljeet Brar | 2,555 | 39.59 | +5.8 | ||||
| Progressive Conservative | Jasmine Brar | 1,681 | 26.23 | +6.4 | ||||
| Liberal | Sarb Gill | 1,178 | 18.26 | -23.3 | ||||
| Manitoba Forward | Edda Pangilinan | 1,022 | 15.92 | |||||
| Total valid votes | 6,508 | 100.0 | ||||||
| Total rejected ballots | ||||||||
| Turnout | 46.08 | |||||||
| Eligible voters | ||||||||
| New Democratic gain from Liberal | Swing | +14.6 | ||||||
| 2016 provincial election redistributed results[1] | |||
|---|---|---|---|
| Party | % | ||
| Liberal | 41.6 | ||
| New Democratic | 33.8 | ||
| Progressive Conservative | 19.8 | ||
| Green | 4.3 | ||
| Others | 0.5 | ||
| 2016 Manitoba general election | ||||||||
|---|---|---|---|---|---|---|---|---|
| Party | Candidate | Votes | % | ±% | Expenditures | |||
| Liberal | Cindy Lamoureux | 2,641 | 46.55 | +34.36 | $20,607.02 | |||
| New Democratic | Melanie Wight | 1,775 | 31.28 | -28.05 | $27,748.99 | |||
| Progressive Conservative | Rae Wagner | 1,014 | 17.87 | -7.58 | $8,151.23 | |||
| Green | Garrett Bodnaryk | 216 | 3.81 | +1.40 | $0.00 | |||
| Communist | Tony Petrowski | 28 | 0.49 | -0.13 | $33.67 | |||
| Total valid votes/Expense limit | 5,674 | 99.11 | $34,273.00 | |||||
| Total rejected and declined ballots | 51 | 0.89 | +0.33 | |||||
| Turnout | 5,725 | 52.60 | +5.52 | |||||
| Eligible voters | 10,883 | |||||||
| Liberal gain from New Democratic | Swing | +31.21 | ||||||
| Source: Elections Manitoba[2][3][4] | ||||||||
| 2011 Manitoba general election | ||||||||
|---|---|---|---|---|---|---|---|---|
| Party | Candidate | Votes | % | ±% | Expenditures | |||
| New Democratic | Melanie Wight | 3,063 | 59.00 | −11.75 | $17,078.77 | |||
| Progressive Conservative | Rick Negrych | 1,314 | 25.31 | +6.55 | $8,890.74 | |||
| Liberal | Twyla Motkaluk | 629 | 12.12 | +1.63 | $30,549.49 | |||
| Green | Garett Peepeetch | 124 | 2.39 | – | $23.08 | |||
| Communist | Frank Komarniski | 32 | 0.62 | – | $312.12 | |||
| Total valid votes | 5,162 | 100.00 | ||||||
| Rejected and declined ballots | 29 | |||||||
| Turnout | 5,191 | 47.08 | −3.04 | |||||
| Electors on the lists | 11,025 | |||||||
| Source: Elections Manitoba[5] | ||||||||
| 2007 Manitoba general election | ||||||||
|---|---|---|---|---|---|---|---|---|
| Party | Candidate | Votes | % | ±% | Expenditures | |||
| New Democratic | Doug Martindale | 3,790 | 70.75 | +1.74 | $16,207.51 | |||
| Progressive Conservative | Rick Negrych | 1,005 | 18.76 | +11.47 | $13,322.81 | |||
| Liberal | Bernd Hohne | 562 | 10.49 | −11.09 | $3,416.97 | |||
| Total valid votes | 5,357 | 100.00 | ||||||
| Rejected and declined ballots | 29 | |||||||
| Turnout | 5,386 | 50.12 | −0.01 | |||||
| Electors on the lists | 10,747 | |||||||
| 2003 Manitoba general election | ||||||||
|---|---|---|---|---|---|---|---|---|
| Party | Candidate | Votes | % | ±% | Expenditures | |||
| New Democratic | Doug Martindale | 4,004 | 69.01 | +2.67 | $14,056.29 | |||
| Liberal | Tony Sanchez | 1,252 | 21.58 | −2.23 | $17,240.92 | |||
| Progressive Conservative | Derek Lambert | 423 | 7.29 | −2.03 | $0.00 | |||
| Green | Catharine Johannson | 123 | 2.12 | – | $200.80 | |||
| Total valid votes | 5,802 | 100.00 | ||||||
| Rejected and declined ballots | 31 | |||||||
| Turnout | 5,833 | 50.13 | −15.50 | |||||
| Electors on the lists | 11,636 | |||||||
| 1999 Manitoba general election | ||||||||
|---|---|---|---|---|---|---|---|---|
| Party | Candidate | Votes | % | ±% | Expenditures | |||
| New Democratic | Doug Martindale | 5,151 | 66.34 | -1.12 | $21,056.00 | |||
| Liberal | Mike Babinsky | 1,849 | 23.81 | +5.82 | $24,553.70 | |||
| Progressive Conservative | Cheryl Clark | 724 | 9.32 | -5.23 | $11,879.28 | |||
| Communist | Darrell Rankin | 41 | 0.53 | n/a | $0.00 | |||
| Total valid votes | 7,765 | 100.00 | ||||||
| Rejected and declined ballots | 55 | |||||||
| Turnout | 7,820 | 65.63 | ||||||
| Electors on the lists | 11,916 | |||||||
| 1995 Manitoba general election | ||||||||
|---|---|---|---|---|---|---|---|---|
| Party | Candidate | Votes | % | ±% | Expenditures | |||
| New Democratic | Doug Martindale | 4,748 | 67.46 | +13.12 | $18,404.00 | |||
| Progressive Conservative | Bill McGee | 1,266 | 17.99 | −1.11 | $13,414.34 | |||
| Liberal | Naty Yankech | 1,024 | 14.55 | −12.01 | $13,401.87 | |||
| Total valid votes | 7,038 | 100.00 | ||||||
| Rejected and declined ballots | 58 | |||||||
| Turnout | 7,096 | 63.90 | −2.96 | |||||
| Electors on the lists | 11,104 | |||||||
| 1990 Manitoba general election | ||||||||
|---|---|---|---|---|---|---|---|---|
| Party | Candidate | Votes | % | ±% | ||||
| New Democratic | Doug Martindale | 4,206 | 54.34 | +13.55 | ||||
| Liberal | William Chornopyski | 2,056 | 26.56 | -15.71 | ||||
| Progressive Conservative | Chris Aune | 1,478 | 19.10 | +4.98 | ||||
| Total valid votes | 7,740 | 100.00 | ||||||
| Rejected ballots | 29 | |||||||
| Turnout | 7,769 | 66.86 | ||||||
| Electors on lists | 11,619 | |||||||
| 1988 Manitoba general election | ||||||||
|---|---|---|---|---|---|---|---|---|
| Party | Candidate | Votes | % | ±% | ||||
| Liberal | William Chornopyski | 3,114 | 42.27 | +33.49 (+20.78) | ||||
| New Democratic | Doug Martindale | 3,005 | 40.79 | -12.25 | ||||
| Progressive Conservative | Allan Yap | 1,040 | 14.12 | -0.08 | ||||
| Independent | Michael Kibzey | 129 | 1.75 | n/a | ||||
| Communist | Lorne Robson | 79 | 1.07 | -0.89 | ||||
| Turnout | 7,412 | 66.05 | ||||||
| Liberal gain from New Democratic | Swing | +16.52 | ||||||
| Source: Elections Manitoba[7] | ||||||||
Previous boundaries

References
- Marcoux, Jacques (2019-08-27). "New Manitoba election boundaries give upper hand to Progressive Conservatives, CBC News analysis finds". CBC. Retrieved 2019-09-14.
- "Candidates: 41st General Election". Elections Manitoba. 29 March 2016. Retrieved 31 March 2016.
- "Candidates: 41st General Election". Elections Manitoba. 2016. Retrieved 22 August 2018.
- "Election Returns: 41st General Election". Elections Manitoba. 2016. Retrieved 23 August 2018.
- "Candidates: 41st General Election". Elections Manitoba. 2011. Retrieved 22 August 2018.
- "Archived copy". Archived from the original on 2011-07-06. Retrieved 2009-12-10.CS1 maint: archived copy as title (link)
- "Historical Summary" (PDF). Retrieved 2018-11-29.