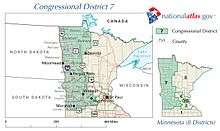
Minnesota's 7th congressional district
Minnesota's 7th congressional district covers almost all of the western side of Minnesota except for the far south, which is in the 1st district. It is by far the state's largest district, and has a very rural character. Cities in the district include Moorhead (its largest city), Fergus Falls, Alexandria and Willmar.
| Minnesota's 7th congressional district | |||
|---|---|---|---|
.tif.png) Minnesota's 7th congressional district - since January 3, 2013. | |||
| Representative |
| ||
| Area | 31,796[1] sq mi (82,350 km2) | ||
| Distribution |
| ||
| Population (2018 est.) | 663,069[3] | ||
| Median income | $58,463[4] | ||
| Ethnicity | |||
| Cook PVI | R+12[6] | ||
Historically, the district has leaned Republican; it has a CPVI of R+12. It has been represented since 1991 by Collin Peterson, a member of the DFL. He is rated 26% conservative by the American Conservative Union for 2017 and 57% progressive by a liberal group.[7] It is the second-most Republican leaning district in the country to be represented by a Democrat after Utah's 4th congressional district.
List of members representing the district
| Member | Party | Years | Cong ress |
Electoral history |
|---|---|---|---|---|
| District created | March 4, 1893 | |||
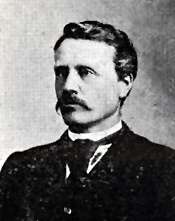 Haldor Boen |
Populist | March 4, 1893 – March 3, 1895 |
53rd | Elected in 1892. Lost re-election. |
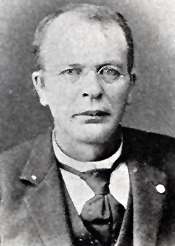 Frank Eddy |
Republican | March 4, 1895 – March 3, 1903 |
54th 55th 56th 57th |
Elected in 1894. Re-elected in 1896. Re-elected in 1898. Re-elected in 1900. Retired. |
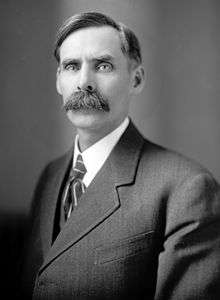 Andrew Volstead |
Republican | March 4, 1903 – March 3, 1923 |
58th 59th 60th 61st 62nd 63rd 64th 65th 66th 67th |
Elected in 1902. Re-elected in 1904. Re-elected in 1906. Re-elected in 1908. Re-elected in 1910. Re-elected in 1912. Re-elected in 1914. Re-elected in 1916. Re-elected in 1918. Re-elected in 1920. Lost re-election. |
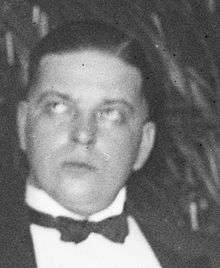
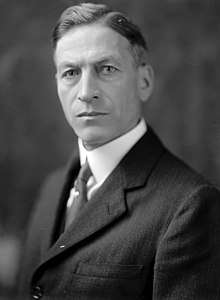 Ole J. Kvale |
Farmer–Labor | March 4, 1923 – September 11, 1929 |
68th 69th 70th 71st |
Elected in 1922. Re-elected in 1924. Re-elected in 1926. Re-elected in 1928. Died. |
| Vacant | September 11, 1929 – October 16, 1929 |
71st | ||
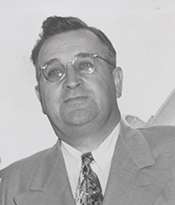
 Paul John Kvale |
Farmer–Labor | October 16, 1929 – March 3, 1933 |
71st 72nd |
Elected to finish Kvale's term. Re-elected in 1930. Redistricted to the at-large district. |
| District inactive | March 4, 1933 – January 3, 1935 |
73rd | All representatives elected at-large on a general ticket. | |
Paul John Kvale |
Farmer–Labor | January 3, 1935 – January 3, 1939 |
74th 75th |
Redistricted from the at-large district and re-elected in 1934. Re-elected in 1936. Lost re-election. |
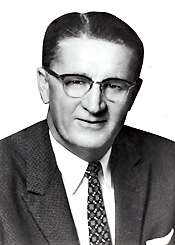
 Herman Carl Andersen |
Republican | January 3, 1939 – January 3, 1963 |
76th 77th 78th 79th 80th 81st 82nd 83rd 84th 85th 86th 87th |
Elected in 1938. Re-elected in 1940. Re-elected in 1942. Re-elected in 1944. Re-elected in 1946. Re-elected in 1948. Re-elected in 1950. Re-elected in 1952. Re-elected in 1954. Re-elected in 1956. Re-elected in 1958. Re-elected in 1960. Lost renomination in a redistricting contest. |
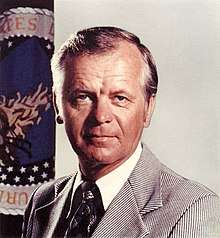
 Odin Langen |
Republican | January 3, 1963 – January 3, 1971 |
88th 89th 90th 91st |
Redistricted from the 9th district and re-elected in 1962. Re-elected in 1964. Re-elected in 1966. Re-elected in 1968. Lost re-election. |
 Robert Bergland |
Democratic– Farmer–Labor |
January 3, 1971 – January 22, 1977 |
92nd 93rd 94th 95th |
Elected in 1970. Re-elected in 1972. Re-elected in 1974. Resigned to become U.S. Secretary of Agriculture. |
| Vacant | January 22, 1977 – February 22, 1977 |
95th | ||
 Arlan Stangeland |
Republican | February 22, 1977 – January 3, 1991 |
95th 96th 97th 98th 99th 100th 101st |
Elected to finish Bergland's term. Re-elected in 1978. Re-elected in 1980. Re-elected in 1982. Re-elected in 1984. Re-elected in 1986. Re-elected in 1988. Lost re-election. |
.jpg) Collin Peterson |
Democratic– Farmer–Labor |
January 3, 1991 – present |
102nd 103rd 104th 105th 106th 107th 108th 109th 110th 111th 112th 113th 114th 115th 116th |
Elected in 1990. Re-elected in 1992. Re-elected in 1994. Re-elected in 1996. Re-elected in 1998. Re-elected in 2000. Re-elected in 2002. Re-elected in 2004. Re-elected in 2006. Re-elected in 2008. Re-elected in 2010. Re-elected in 2012. Re-elected in 2014. Re-elected in 2016. Re-elected in 2018. |
Elections
2002
| Party | Candidate | Votes | % | ± | |
|---|---|---|---|---|---|
| Democratic | Collin Peterson | 170,234 | 65.27 | - | |
| Republican | Dan Stevens | 90,342 | 34.64 | - | |
2004
| Party | Candidate | Votes | % | ± | |
|---|---|---|---|---|---|
| Democratic | Collin Peterson | 207,628 | 66.07 | +1 | |
| Republican | David Sturrock | 106,349 | 33.84 | - | |
2006
| Party | Candidate | Votes | % | ± | |
|---|---|---|---|---|---|
| Democratic | Collin Peterson | 179,164 | 70 | +4 | |
| Republican | Michael Barrett | 74,557 | 29 | - | |
| Constitution | Ken Lucier | 3,303 | 1 | - | |
2008
| Party | Candidate | Votes | % | ± | |
|---|---|---|---|---|---|
| Democratic | Collin Peterson | 227,180 | 72.20 | +2.2 | |
| Republican | Glen Menze | 87,062 | 27.67 | - | |
| N/A | others | 431 | 0.14 | - | |
2010
| Party | Candidate | Votes | % | ± | |
|---|---|---|---|---|---|
| Democratic | Collin Peterson | 159,479 | 52.5 | -19.7 | |
| Republican | Lee Byberg | 90,650 | 37.6 | +9.2 | |
| N/A | others | 17,155 | 7.2 | - | |
2012
| Party | Candidate | Votes | % | ± | |
|---|---|---|---|---|---|
| Democratic | Collin Peterson | 197,791 | 60.4 | +7.9 | |
| Republican | Lee Byberg | 114,151 | 34.8 | -2.8 | |
| N/A | others | 4.7 | - | ||
2014
| Party | Candidate | Votes | % | ± | |
|---|---|---|---|---|---|
| Democratic | Collin Peterson | 130,546 | 54.2 | -6.2 | |
| Republican | Torrey Westrom | 109,955 | 45.7 | +10.9 | |
| N/A | others | 334 | 0.1 | - | |
2016
| Party | Candidate | Votes | % | ± | |
|---|---|---|---|---|---|
| Democratic | Collin Peterson | 173,589 | 52.5 | -1.7 | |
| Republican | Dave Hughes | 156,952 | 47.4 | +1.7 | |
| N/A | others | 307 | 0.1 | - | |
2018
| Party | Candidate | Votes | % | ± | |
|---|---|---|---|---|---|
| Democratic | Collin Peterson | 146,672 | 52.1 | -0.4 | |
| Republican | Dave Hughes | 134,668 | 47.9 | +0.4 | |
| N/A | others | 168 | >0.1 | - | |
Election results from presidential races
Election results from presidential races:
| Year | Office | Results | Political parties that won the district |
|---|---|---|---|
| 2000 | President | George W. Bush 54 - Al Gore 40% | Republican Party (United States) |
| 2004 | President | George W. Bush 55 - John Kerry 43% | Republican Party (United States) |
| 2008 | President | John McCain 50 - Barack Obama 47% | Republican Party (United States) |
| 2012 | President | Mitt Romney 53.9 - Barack Obama 44.1% | Republican Party (United States) |
| 2016 | President | Donald Trump 61.8 - Hillary Clinton 31% | Republican Party (United States) |
Historical district boundaries
References
- "Minnesota congressional districts by urban and rural population and land area" (PDF). US Census Bureau. 2000. Retrieved April 2, 2007.
- Geography, US Census Bureau. "Congressional Districts Relationship Files (state-based)". www.census.gov. Retrieved April 7, 2018.
- Bureau, Center for New Media & Promotion (CNMP), US Census. "My Congressional District". www.census.gov. Retrieved April 7, 2018.
- https://www.census.gov/mycd/?st=27&cd=07
- https://censusreporter.org/profiles/50000US2707-congressional-district-7-mn/
- "Partisan Voting Index – Districts of the 115th Congress" (PDF). The Cook Political Report. April 7, 2017. Retrieved April 19, 2017.
- "Leading with the Left". Progressive Punch. Retrieved November 2, 2006.