Miles Platting and Newton Heath
Miles Platting and Newton Heath is an electoral ward in the city of Manchester, North West England which covers the districts of Miles Platting and Newton Heath. The population of this ward at the 2011 census was 14,693.[1]
| Miles Platting and Newton Heath | |
|---|---|
_2018.png) Miles Platting and Newton Heath electoral ward within Manchester City Council | |
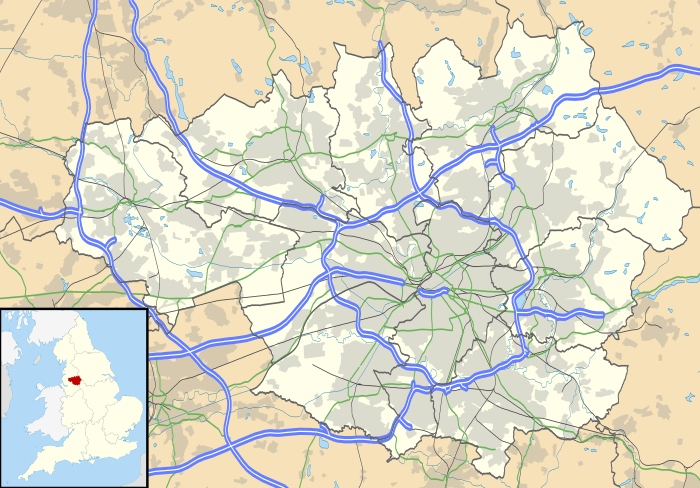
 Miles Platting and Newton Heath Location within Greater Manchester | |
| Population | 14,693 (2011 Census |
| OS grid reference | SJ8558696962 |
| Metropolitan borough | |
| Metropolitan county | |
| Region | |
| Country | England |
| Sovereign state | United Kingdom |
| Post town | MANCHESTER |
| Postcode district | M40 |
| Dialling code | 0161 |
| Police | Greater Manchester |
| Fire | Greater Manchester |
| Ambulance | North West |
| UK Parliament | |
| Councillors |
|
Councillors

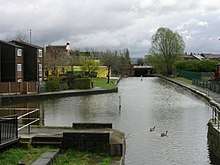
Rochdale Canal at Newton Heath.
The three Labour Party councilors who represent the ward are John Flanagan,[2] June Hitchen[3] and Carmine Grimshaw.[4]
| Election | Councillor | Councillor | Councillor | |||
|---|---|---|---|---|---|---|
| 2004 | John Flanagan (Lab) | June Hitchin (Lab) | Christine Carroll (Lab) | |||
| 2006 | John Flanagan (Lab) | June Hitchin (Lab) | Christine Carroll (Lab) | |||
| 2007 | John Flanagan (Lab) | June Hitchin (Lab) | Christine Carroll (Lab) | |||
| 2008 | John Flanagan (Lab) | June Hitchin (Lab) | Damien O'Connor (Lib Dem) | |||
| 2010 | John Flanagan (Lab) | June Hitchin (Lab) | Damien O'Connor (Lib Dem) | |||
| 2011 | John Flanagan (Lab) | June Hitchin (Lab) | Damien O'Connor (Lib Dem) | |||
| 2012 | John Flanagan (Lab) | June Hitchin (Lab) | Carmine Grimshaw (Lab) | |||
| 2014 | John Flanagan (Lab) | June Hitchin (Lab) | Carmine Grimshaw (Lab) | |||
| 2015 | John Flanagan (Lab) | June Hitchin (Lab) | Carmine Grimshaw (Lab) | |||
| 2016 | John Flanagan (Lab) | June Hitchin (Lab) | Carmine Grimshaw (Lab) | |||
| 2018 | John Flanagan (Lab) | June Hitchin (Lab) | Carmine Grimshaw (Lab) | |||
| 2019 | John Flanagan (Lab) | June Hitchin (Lab) | Carmine Grimshaw (Lab) | |||
indicates seat up for re-election.
Elections in 2010s
* denotes incumbent councillor seeking re-election.
May 2019
| Party | Candidate | Votes | % | ± | |
|---|---|---|---|---|---|
| Labour | John Flanagan* | 1,601 | 60.3% | ||
| UKIP | Christopher Owen | 459 | 17.3% | ||
| Green | Stephanie Wyatt | 213 | 8.0% | ||
| Independent | Francesco Falcioni | 133 | 5.0% | n/a | |
| Conservative | Michael Ciotkowski | 128 | 4.8% | ||
| Liberal Democrats | Simon Lepori | 101 | 3.8% | n/a | |
| Majority | 1,142 | 43.0% | |||
| Rejected ballots | 21 | 0.79% | |||
| Turnout | 2,656 | 21.25% | |||
| Registered electors | 12,499 | ||||
| Labour hold | Swing | ||||
May 2018
| Party | Candidate | Votes | % | ± | |
|---|---|---|---|---|---|
| Labour | Carmine Grimshaw* | 1,969 | 70.5 | ||
| Labour | June Hitchen* | 1,953 | 69.9 | ||
| Labour | John Flanaghan* | 1,769 | 63.3 | ||
| UKIP | Martin Power | 297 | 10.6 | ||
| Conservative | Beverley Cottrell | 276 | 9.9 | ||
| Green | Paul Madley | 268 | 9.6 | ||
| Conservative | Vera Berry | 250 | 8.9 | ||
| Conservative | Jacqueline Mountaine | 212 | 7.6 | ||
| TUSC | Bridget Taylor | 115 | 4.1 | ||
| Majority | |||||
| Turnout | 2,794 | 22.4 | |||
| Labour win (new boundaries) | |||||
| Labour win (new boundaries) | |||||
| Labour win (new boundaries) | |||||
May 2016
| Party | Candidate | Votes | % | ± | |
|---|---|---|---|---|---|
| Labour | Carmine Geatano Grimshaw* | 1,938 | 78.49 | ||
| Conservative | Harry Kagkouras | 193 | 7.82 | ||
| Green | Isobel Mary Patience | 134 | 5.43 | ||
| Liberal Democrats | Richard Martin Kilpatrick | 116 | 4.70 | ||
| TUSC | Bridget Taylor | 88 | 3.56 | ||
| Majority | 1,745 | 70.68 | |||
| Turnout | 2,469 | 24.12 | |||
| Labour hold | Swing | ||||
May 2015
| Party | Candidate | Votes | % | ± | |
|---|---|---|---|---|---|
| Labour | June Hitchen* | 3,635 | 73.1 | +4.8 | |
| Conservative | Harry Kagouras | 530 | 10.7 | +7.1 | |
| Green | Nathan Rae | 350 | 7.0 | +3.4 | |
| Liberal Democrats | John Richard Bridges | 257 | 5.2 | -13.0 | |
| TUSC | Tom Simpson | 202 | 4.0 | N/A | |
| Majority | 3,105 | 62.4 | |||
| Turnout | 4,974 | 47.4 | +19.5 | ||
| Labour hold | Swing | ||||
May 2014
| Party | Candidate | Votes | % | ± | |
|---|---|---|---|---|---|
| Labour | John Flanagan | 1,826 | 65.24 | ||
| BNP | Gareth Black | 397 | 14.18 | ||
| Green | Jake Lay | 242 | 8.65 | ||
| Conservative | Benjamin John Michael Thacker | 190 | 6.79 | ||
| Liberal Democrats | Grace Baynham | 144 | 5.14 | ||
| Majority | 1,429 | 51.1 | |||
| Turnout | 2,799 | 25.82 | |||
| Labour hold | Swing | ||||
May 2012
| Party | Candidate | Votes | % | ± | |
|---|---|---|---|---|---|
| Labour | Carmine Grimshaw | 1,807 | 65.0 | +25.5 | |
| Liberal Democrats | Damien O'Connor* | 830 | 29.8 | -15.8 | |
| Green | Jacob Lay | 145 | 5.2 | +2.6 | |
| Majority | 977 | 35 | |||
| Turnout | 2,782 | 25.76 | |||
| Labour gain from Liberal Democrats | Swing | ||||
May 2011
| Party | Candidate | Votes | % | ± | |
|---|---|---|---|---|---|
| Labour | June Hitchen* | 2,039 | 68.3 | +25.7 | |
| Liberal Democrats | Victoria Roberts | 544 | 18.2 | -22.4 | |
| BNP | Joseph Cegla | 186 | 6.2 | -2.0 | |
| Conservative | Natalie Chapman | 108 | 3.6 | -0.4 | |
| Green | Christopher Hyland | 108 | 3.6 | +1.2 | |
| Majority | 1,495 | 50.1 | |||
| Turnout | 2,985 | 27.9 | |||
| Labour hold | Swing | ||||
May 2010
| Party | Candidate | Votes | % | ± | |
|---|---|---|---|---|---|
| Labour | John Flanagan* | 2,402 | 50.1 | +10.6 | |
| Liberal Democrats | Gerry Diamond | 1,596 | 33.3 | -12.3 | |
| BNP | John O'Shaughnessy | 400 | 8.3 | +0.4 | |
| Conservative | Sheraz Sherazi | 265 | 5.5 | +0.9 | |
| Green | Christopher Hyland | 80 | 1.7 | -0.9 | |
| Libertarian | Stuart Charles Heal | 55 | 1.1 | +1.1 | |
| Majority | 806 | 16.8 | +11.0 | ||
| Turnout | 4,79 | 45.8 | +14.8 | ||
| Labour hold | Swing | +11.4 | |||
gollark: Adverts in the OS.
gollark: Ever seen Win10?
gollark: 🐧OS!
gollark: Oh well then. Linux is better anyway.
gollark: Could the WSL work?
References
- "City of Manchester Ward population 2011". Retrieved 5 January 2016.
- "John Flanagan". manchester.gov.uk. Manchester City Council. Retrieved 24 May 2018.
- "June Hitchen". manchester.gov.uk. Manchester City Council. Retrieved 24 May 2018.
- "Carmine Grimshaw". manchester.gov.uk. Manchester City Council. Retrieved 24 May 2018.
- "Election results (wards M to W)". manchester.gov.uk. Manchester City Council. 4 May 2018. Retrieved 24 May 2018.
This article is issued from Wikipedia. The text is licensed under Creative Commons - Attribution - Sharealike. Additional terms may apply for the media files.