Michigan's 9th congressional district
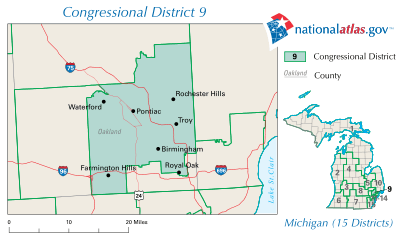
Michigan's 9th congressional district is located in parts of Oakland and Macomb counties in the southeast areas of the U.S. state of Michigan. It includes the communities of Ferndale, Royal Oak, Hazel Park, St.Clair Shores, Warren, Bloomfield, and Sterling Heights.
| Michigan's 9th congressional district | |||
|---|---|---|---|
.tif.png) Michigan's 9th congressional district since January 3, 2013 | |||
| Representative |
| ||
| Population (2010) | 705,975 | ||
| Median income | $58,742[1] | ||
| Ethnicity |
| ||
| Cook PVI | D+4[2] | ||
Recent election results from statewide races
| Year | Office | Results |
|---|---|---|
| 1992 | President | Clinton 44 - 35% |
| 1996 | President | Clinton 46 - 43% |
| 2000 | President | Bush 51 - 47% |
| 2004 | President | Bush 51 - 49% |
| 2008 | President | Obama 56 - 43% |
| 2012 | President | Obama 57 - 42% |
| 2016 | President | Clinton 52 - 44% |
| 2018 | Senate | Stabenow 58 - 39% |
| 2018 | Governor | Whitmer 59 - 38% |
History
Prior to 1992 the 9th congressional district did not overlap at all with the one that existed after 1992. It largely corresponded to the later Michigan's 2nd congressional district, covering most of the western shore counties starting with Muskegon and taking in a portion of Grand Traverse County. It also included about half of Ottawa County, Montcalm County, half of Ionia County, and two eastern townships of Kent County, Michigan.
The district from 1992 to 2002 was largely based in Pontiac and Flint–essentially, the successor of the old 7th district. The strong Democratic voting record in Flint and Pontiac compensated for the largely Republican leaning of most of the rest of the district's area.
In 2002, this district essentially became the 5th district, while the 9th was reconfigured to take in most of the Oakland County portion of the old 11th district. The only areas that survived in the 9th congressional district across the 2002 redistricting were Pontiac, Waterford, Auburn Hills, some of Orion Township, Oakland Township, Rochester and Rochester Hills. This district was for all practical purposes the one eliminated by the 2012 redistricting. Portions of it were parceled out to four different districts, all of which largely preserved other former districts. The current 9th is mostly the successor of the old 12th district.
The district is currently represented by Andy Levin.
Cities, townships, and villages
Cities
|
Villages
List of representatives
| Representative | Party | Years | Congress | Notes |
|---|---|---|---|---|
| District created | March 4, 1873 | |||
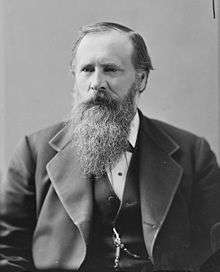 | Republican | March 4, 1873 - March 3, 1883 | 43rd 44th 45th 46th 47th | |
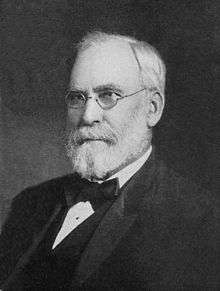 | Republican | March 4, 1883 - March 3, 1891 | 48th 49th 50th 51st | |
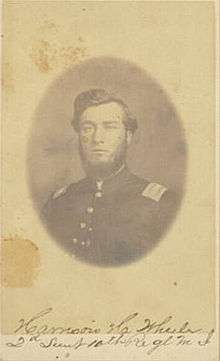 | Democratic | March 4, 1891 - March 3, 1893 | 52nd | |
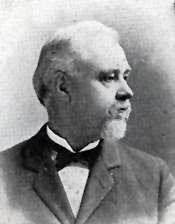 | Republican | March 4, 1893 - March 3, 1895 | 53rd | |
.jpg) | Republican | March 4, 1895 - March 3, 1907 | 54th 55th 56th 57th 58th 59th | |
.jpg) | Republican | March 4, 1907 - November 29, 1932 | 60th 61st 62nd 63rd 64th 65th 66th 67th 68th 69th 70th 71st 72nd | Died |
| Vacant | November 29, 1932 – March 4, 1933 | |||
 | Democratic | March 4, 1933 - January 3, 1935 | 73rd | |
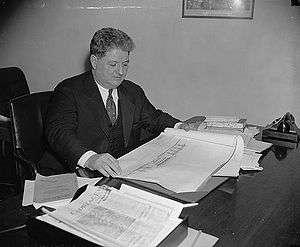 | Republican | January 3, 1935 - January 3, 1951 | 74th 75th 76th 77th 78th 79th 80th 81st | |
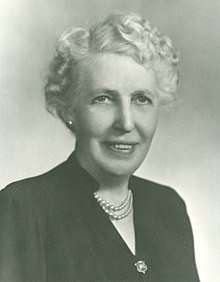 | Republican | January 3, 1951 - January 3, 1957 | 82nd 83rd 84th | |
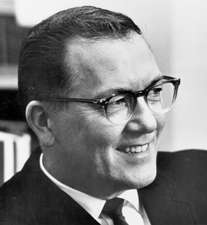 | Republican | January 3, 1957 - May 11, 1966 | 85th 86th 87th 88th 89th | Resigned after being appointed to the US Senate |
| Vacant | May 11, 1966 – November 8, 1966 | |||
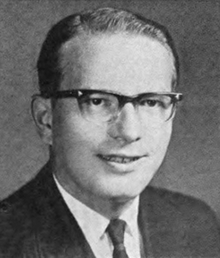 | Republican | November 8, 1966 - January 3, 1993 | 89th 90th 91st 92nd 93rd 94th 95th 96th 97th 98th 99th 100th 101st 102nd | |
| Democratic | January 3, 1993 - January 3, 2003 | 103rd 104th 105th 106th 107th | Redistricted from the 7th district, Redistricted to the 5th district | |
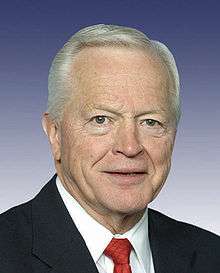 | Republican | January 3, 2003 - January 3, 2009 | 108th 109th 110th | Redistricted from the 11th district |
 | Democratic | January 3, 2009 - January 3, 2013 | 111th 112th | Redistricted to the 14th district |
| Democratic | January 3, 2013 - January 3, 2019 | 113th 114th 115th | Redistricted from the 12th district | |
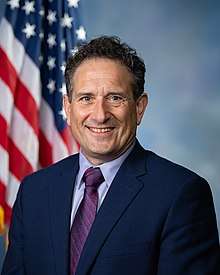 | Democratic | January 3, 2019 - Present | 116th | |
Elections
| Party | Candidate | Votes | % | ± | |
|---|---|---|---|---|---|
| Democratic | Andy Levin | 181,734 | 59.7 | +1.8 | |
| Republican | Candius Stearns | 112,123 | 36.8 | -0.6 | |
| Working Class | Andrea Kirby | 6,797 | 2.2 | N/A | |
| Green | John V. McDermott | 3,909 | 1.3 | -0.6 | |
| Majority | 69,611 | 22.9 | |||
| Turnout | 304,563 | -12% | |||
| Party | Candidate | Votes | % | ± | |
|---|---|---|---|---|---|
| Democratic | Sander Levin (incumbent) | 199,661 | 57.9 | -2.5 | |
| Republican | Christopher Morse | 128,937 | 37.4 | +1.3 | |
| Libertarian | Matthew Orlando | 9,563 | 2.8 | +0.7 | |
| Green | John V. McDermott | 6,614 | 1.9 | +0.4 | |
| Majority | 70,724 | 20.5 | |||
| Turnout | 344,775 | +53% | |||
| Party | Candidate | Votes | % | ± | |
|---|---|---|---|---|---|
| Democratic | Sander Levin (incumbent) | 136,342 | 60.4 | -1.5 | |
| Republican | George Brikho | 81,470 | 36.1 | +2.1 | |
| Libertarian | Gregory Creswell | 4,792 | 2.1 | +0.3 | |
| Green | John V. McDermott | 3,153 | 1.4 | +0.0 | |
| Majority | 54,872 | 24.3 | |||
| Turnout | 225,757 | -33% | |||
| Party | Candidate | Votes | % | ± | |
|---|---|---|---|---|---|
| Democratic | Sander Levin (incumbent) | 208,846 | 61.9 | +12.1 | |
| Republican | Don Volaric | 114,760 | 34.0 | -13.2 | |
| Libertarian | Jim Fulner | 6,100 | 1.8 | -0.8 | |
| Green | Julia Williams | 4,708 | 1.4 | -0.4 | |
| Taxpayers | Les Townsend | 2,902 | 0.9 | N/A | |
| Majority | 94,086 | 27.9 | |||
| Turnout | 337,316 | +34% | |||
| Party | Candidate | Votes | % | ± | |
|---|---|---|---|---|---|
| Democratic | Gary Peters (incumbent) | 125,730 | 49.8 | -2.3 | |
| Republican | Rocky Raczkowski | 119,325 | 47.2 | +4.6 | |
| Libertarian | Adam Goodman | 2,601 | 1.0 | -0.4 | |
| Green | Douglas Campbell | 2,484 | 1.0 | -0.4 | |
| Independent | Bob Gray | 1,866 | 0.7 | N/A | |
| Independent | Matthew Kuofie | 644 | 0.3 | N/A | |
| Plurality | 6,405 | 2.5 | |||
| Turnout | 252,650 | -29% | |||
| Party | Candidate | Votes | % | ± | |
|---|---|---|---|---|---|
| Democratic | Gary Peters | 184,098 | 52.1 | +5.9 | |
| Republican | Joe Knollenberg (incumbent) | 150,574 | 42.6 | -9.0 | |
| Independent | Jack Kevorkian | 9,047 | 2.6 | N/A | |
| Libertarian | Adam Goodman | 4,937 | 1.4 | +0.1 | |
| Green | Douglas Campbell | 4,800 | 1.4 | +0.5 | |
| Majority | 33,524 | 9.5 | |||
| Turnout | 353,456 | +28% | |||
| Party | Candidate | Votes | % | ± | |
|---|---|---|---|---|---|
| Republican | Joe Knollenberg (incumbent) | 142,279 | 51.6 | ||
| Democratic | Nancy Skinner | 127,651 | 46.2 | ||
| Libertarian | Adam Goodman | 3,698 | 1.3 | ||
| Green | Matthew Abel | 2,466 | 0.9 | ||
| Majority | 14,628 | 5.3 | |||
| Turnout | 276,094 | ||||
Historical district boundaries
Notes
- "My Congressional District".
- "Partisan Voting Index – Districts of the 115th Congress" (PDF). The Cook Political Report. April 7, 2017. Retrieved April 7, 2017.
- James C. McLaughlin died November 29, 1932; the vacancy was not filled.
- Robert P. Griffin resigned on May 10, 1966, to be appointed the following day to the United States Senate to fill vacancy caused by the death of Patrick V. McNamara; Guy Vander Jagt was elected simultaneously in a special election November 8, 1966, to fill the unexpired term in the 89th and for a full term in the 90th Congress.
- Dale Kildee now represents the 5th district.
District boundaries were redrawn in 1993, and 2003 due to reapportionment following the censuses of 1990 and 2000.
References
- Gary Peters's webpage
- Govtrack.us for the 9th District - Lists current Senators and representative, and map showing district outline
- The Political graveyard: U.S. Representatives from Michigan, 1807-2003
- U.S. Representatives 1837-2003, Michigan Manual 2003-2004
- Martis, Kenneth C. (1989). The Historical Atlas of Political Parties in the United States Congress. New York: Macmillan Publishing Company.
- Martis, Kenneth C. (1982). The Historical Atlas of United States Congressional Districts. New York: Macmillan Publishing Company.
- Congressional Biographical Directory of the United States 1774–present