Markham—Unionville
Markham—Unionville is a federal electoral district in Ontario, Canada, that has been represented in the House of Commons of Canada since 2004.
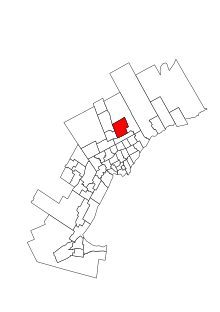
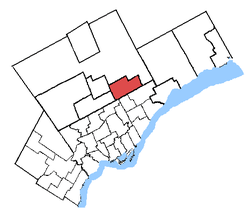
 Markham—Unionville in relation to other Greater Toronto ridings | |||
| Federal electoral district | |||
| Legislature | House of Commons | ||
| MP |
Conservative | ||
| District created | 2003 | ||
| First contested | 2004 | ||
| Last contested | 2019 | ||
| District webpage | profile, map | ||
| Demographics | |||
| Population (2016)[1] | 123,318 | ||
| Electors (2015) | 81,583 | ||
| Area (km²)[2] | 89 | ||
| Pop. density (per km²) | 1,385.6 | ||
| Census divisions | York | ||
| Census subdivisions | Markham | ||

.png)
Boundaries
Markham—Unionville is located in the City of Markham within an area bordered by a line commencing at the Highway 404-407 interchange, then east along Highway 407 to McCowan Road, north on McCowan Road to 16th Avenue, east on 16th to Highway 48, then to the northern city limit, then along the northern and western city boundaries to the 404-407 interchange.[3]
Demographics
- According to the Canada 2011 Census; 2013 representation[4]
Ethnic groups: 57.2% Chinese, 21.1% White, 10.9% South Asian, 1.9% Black, 1.9% Filipino, 1.5% Arab, 1.1% West Asian
Languages: 47.0% Chinese, 36.3% English, 1.9% Tamil, 1.3% Italian, 1.1% Urdu, 1.0% Gujarati, 1.0% Tagalog, 1.0% Arabic, 1.0% French
Religions: 43.7% Christian (20.5% Catholic, 4.4% Christian Orthodox, 3.2% Baptist, 2.2% Anglican, 2.1% United Church, 1.0% Presbyterian, 10.4% Other), 5.2% Buddhist, 5.1% Muslim, 5.1% Hindu, 39.8% No religion
Median income (2010): $27,701
Average income (2010): $46,680
History
It is located in the province of Ontario, and covers suburban areas north of Toronto. It was created in 2003 from Markham. The federal riding has been represented by John McCallum, until he switched to the newly formed Markham—Thornhill riding for the 2015 election. Markham—Unionville was the only seat that the Liberals lost among those they held after the 2011 election, though the riding's boundaries changed considerably and would have been won by the Conservatives in 2011 based on the redistributed results.
Most of (54%) Markham—Unionville (mostly south of Highway 407) was redistributed into the new Markham—Thornhill riding for the 2015 election. The area north of Highway 407 and west of McCowan Road remained in Markham—Unionville. The new Markham—Unionville riding also took in newer subdivisions in the northwest corner of the city, which were previously in the riding of Oak Ridges—Markham. 51% of the new riding came from Oak Ridges—Markham.
Members of Parliament
The riding has elected the following Members of Parliament:
| Parliament | Years | Member | Party | |
|---|---|---|---|---|
| Markham—Unionville Riding created from Markham |
||||
| 38th | 2004–2006 | John McCallum | Liberal | |
| 39th | 2006–2008 | |||
| 40th | 2008–2011 | |||
| 41st | 2011–2015 | |||
| 42nd | 2015–2019 | Bob Saroya | Conservative | |
| 43rd | 2019–present | |||
Election results
2015-present

| 2019 Canadian federal election | ||||||||
|---|---|---|---|---|---|---|---|---|
| Party | Candidate | Votes | % | ±% | Expenditures | |||
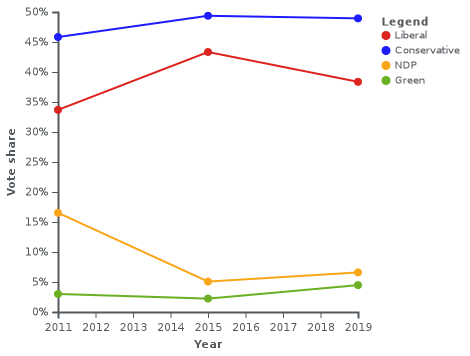
| Conservative | Bob Saroya | 26,133 | 48.94 | -0.43 | ||||
| Liberal | Alan Ho | 20,484 | 38.36 | -4.97 | ||||
| New Democratic | Gregory Hines | 3,524 | 6.60 | +1.53 | ||||
| Green | Elvin Kao | 2,394 | 4.48 | +2.25 | ||||
| People's | Sarah Chung | 861 | 1.61 | – | ||||
| Total valid votes/Expense limit | 53,396 | 100.0 | – | |||||
| Total rejected ballots | 523 | 0.97 | – | |||||
| Turnout | 53,919 | 60.90 | +0.22 | |||||
| Eligible voters | 88,538 | |||||||
| Conservative hold | Swing | +4.54 | ||||||
| Source: Elections Canada[5][6] | ||||||||
| 2015 Canadian federal election | ||||||||
|---|---|---|---|---|---|---|---|---|
| Party | Candidate | Votes | % | ±% | Expenditures | |||
| Conservative | Bob Saroya | 24,605 | 49.37 | +3.54 | $148,191.54 | |||
| Liberal | Bang-Gu Jiang | 21,596 | 43.33 | +9.64 | $105,134.99 | |||
| New Democratic | Colleen Zimmerman | 2,528 | 5.07 | -11.45 | $3,111.82 | |||
| Green | Elvin Kao | 1,110 | 2.23 | -0.77 | $4,322.49 | |||
| Total valid votes/Expense limit | 49,839 | 100.00 | – | $218,774.36 | ||||
| Total rejected ballots | 246 | 0.49 | – | |||||
| Turnout | 50,085 | 60.68 | ||||||
| Eligible voters | 82,534 | |||||||
| Conservative notional hold | Swing | -6.10 | ||||||
| Source: Elections Canada[7][8] | ||||||||
| 2011 federal election redistributed results[9] | |||
|---|---|---|---|
| Party | Vote | % | |
| Conservative | 18,025 | 45.83 | |
| Liberal | 13,250 | 33.69 | |
| New Democratic | 6,500 | 16.53 | |
| Green | 1,179 | 3.00 | |
| Others | 376 | 0.96 | |
| Total | 39,330 | 100.0 | |
2004-2011

| 2011 Canadian federal election | ||||||||
|---|---|---|---|---|---|---|---|---|
| Party | Candidate | Votes | % | ±% | Expenditures | |||
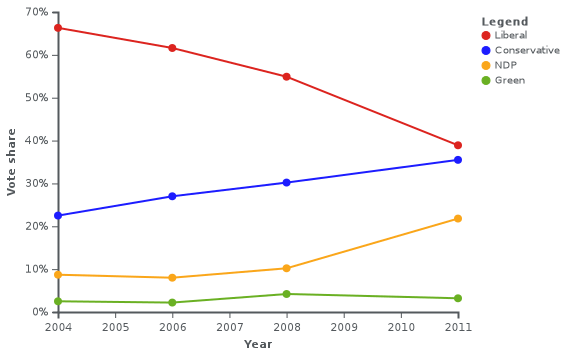
| Liberal | John McCallum | 19,429 | 38.9 | -16.0 | $73,376.21 | |||
| Conservative | Bob Saroya | 17,734 | 35.5 | +5.3 | $87,364.37 | |||
| New Democratic | Nadine Hawkins | 10,897 | 21.8 | +11.6 | $456.44 | |||
| Green | Adam Poon | 1,597 | 3.2 | -1.0 | $10,810.65 | |||
| Libertarian | Allen Small | 231 | 0.5 | – | $1,384.33 | |||
| Total valid votes/Expense Limit | 49,888 | 100.0 | – | $95,073.73 | ||||
| Total rejected ballots | 290 | 0.6 | – | |||||
| Turnout | 50,178 | 55.1 | +2.8 | |||||
| Eligible voters | 91,057 | – | – | |||||
| 2008 Canadian federal election | ||||||||
|---|---|---|---|---|---|---|---|---|
| Party | Candidate | Votes | % | ±% | Expenditures | |||
| Liberal | John McCallum | 25,195 | 54.9 | -6.7 | $58,875 | |||
| Conservative | Duncan Fletcher | 13,855 | 30.2 | +3.2 | $58,523 | |||
| New Democratic | Nadine Hawkins | 4,682 | 10.2 | +2.2 | $4,250 | |||
| Green | Leonard Aitken | 1,931 | 4.2 | +2.0 | $2,524 | |||
| Libertarian | Allen Small | 229 | 0.5 | N/A | $348 | |||
| Total valid votes/Expense limit | 45,892 | 100.0 | – | $90,944.51 | ||||
| Turnout | – | 52.31 | ||||||
| 2006 Canadian federal election | ||||||||
|---|---|---|---|---|---|---|---|---|
| Party | Candidate | Votes | % | ±% | ||||
| Liberal | John McCallum | 32,797 | 61.6 | -4.7 | ||||
| Conservative | Joe Li | 14,357 | 27.0 | +4.5 | ||||
| New Democratic | Janice Hagan | 4,266 | 8.0 | -0.7 | ||||
| Green | Wesley Weese | 1,151 | 2.2 | -0.3 | ||||
| Progressive Canadian | Fayaz Choudhary | 363 | 0.7 | |||||
| Independent | Partap Dua | 297 | 0.6 | |||||
| Total valid votes | 53,231 | 100.0 | ||||||
| 2004 Canadian federal election | ||||||||
|---|---|---|---|---|---|---|---|---|
| Party | Candidate | Votes | % | |||||
| Liberal | John McCallum | 30,442 | 66.3 | |||||
| Conservative | Joe Li | 10,325 | 22.5 | |||||
| New Democratic | Janice Hagan | 3,993 | 8.7 | |||||
| Green | Ed Wong | 1,148 | 2.5 | |||||
| Total valid votes | 45,908 | 100.0 | ||||||
See also
- List of Canadian federal electoral districts
- Past Canadian electoral districts
References
Citations
- Statistics Canada: 2017
- Statistics Canada: 2012
- http://elections.ca/Scripts/vis/Map?L=e&ED=35056&EV=41&EV_TYPE=1&PC=L6C2B5&PROV=ON&PROVID=35&QID=-1&PAGEID=27
- http://www12.statcan.gc.ca/nhs-enm/2011/dp-pd/prof/details/page.cfm?Lang=E&Geo1=FED2013&Code1=35056&Data=Count&SearchText=Markham&SearchType=Begins&SearchPR=01&A1=All&B1=All&Custom=&TABID=1
- "List of confirmed candidates". Elections Canada. Retrieved October 3, 2019.
- "Election Night Results". Elections Canada. Retrieved November 4, 2019.
- Elections Canada – Confirmed candidates for Markham—Unionville, 30 September 2015
- Elections Canada – Preliminary Election Expenses Limits for Candidates Archived 2016-03-04 at the Wayback Machine
- Pundits' Guide to Canadian Elections
Sources
- "(Code 35045) Census Profile". 2011 census. Statistics Canada. 2012. Retrieved 2011-03-03.
- Riding history from the Library of Parliament
- 2011 Results from Elections Canada
- Campaign expense data from Elections Canada