Kitchener Centre
Kitchener Centre (French: Kitchener-Centre) is a federal electoral district in Ontario, Canada, that has been represented in the House of Commons of Canada since 1997.
 Kitchener Centre in relation to Southern Ontario ridings | |||
| Federal electoral district | |||
| Legislature | House of Commons | ||
| MP |
Liberal | ||
| District created | 1996 | ||
| First contested | 1997 | ||
| Last contested | 2019 | ||
| District webpage | profile, map | ||
| Demographics | |||
| Population (2011)[1] | 102,433 | ||
| Electors (2015) | 76,163 | ||
| Area (km²)[2] | 44 | ||
| Pop. density (per km²) | 2,328 | ||
| Census divisions | Waterloo | ||
| Census subdivisions | Kitchener | ||
Geography
The district includes the north-central and north-eastern parts of the city of Kitchener, Ontario, including the downtown core.
Political geography
In 2008, the race in Kitchener was razor thin between the Conservatives and Liberals. Politically, the riding is split by the Conestoga Parkway. The area to the west of the Parkway tends to support the Liberals while the area to the east of the Parkway tends to vote for the Conservatives. The NDP also won a small handful of polls, scattered around the riding.[3]
History
The electoral district was created in 1996 from parts of Kitchener and Kitchener—Waterloo ridings.
It initially consisted of the part of the City of Kitchener bounded on the west by the western limit of the city, on the south by a line drawn from west to east along the Conestoga Parkway, Strasburg Road, Block Line Road, the Canadian Pacific Railway line, and Highway No. 8, on the east by the Grand River, and on the north by a line drawn from east to west along Victoria Street, Lawrence Avenue and Highland Road West.
In 2003, it was redefined to consist of the part of the City of Kitchener bounded on the west by the western limit of the city, on the north by a line drawn from west to east along Highland Road West, Fischer Hallman Road and the Canadian National Railway situated northerly of Shadeland Crescent, on the east by the Grand River, and on the south by a line drawn from east to west along the King Street Bypass (Highway No. 8), King Street East and the Conestoga Parkway.
This riding lost territory to Kitchener—Conestoga and Kitchener South—Hespeler, and gained territory from Kitchener—Waterloo during the 2012 electoral redistribution.
Member of Parliament
This riding has elected the following Member of Parliament:
| Parliament | Years | Member | Party | |
|---|---|---|---|---|
| Kitchener Centre Riding created from Kitchener and Kitchener—Waterloo |
||||
| 36th | 1997–2000 | Karen Redman | Liberal | |
| 37th | 2000–2004 | |||
| 38th | 2004–2006 | |||
| 39th | 2006–2008 | |||
| 40th | 2008–2011 | Stephen Woodworth | Conservative | |
| 41st | 2011–2015 | |||
| 42nd | 2015–2019 | Raj Saini | Liberal | |
| 43rd | 2019–present | |||
Election results
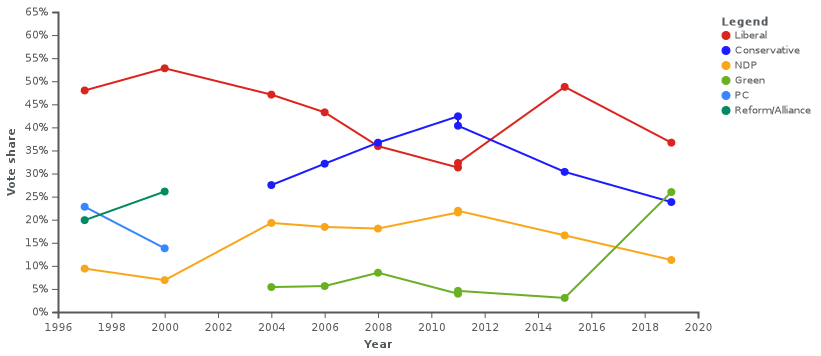
| 2019 Canadian federal election | ||||||||
|---|---|---|---|---|---|---|---|---|
| Party | Candidate | Votes | % | ±% | Expenditures | |||
| Liberal | Raj Saini | 20,316 | 36.69 | -12.09 | ||||
| Green | Mike Morrice | 14,394 | 25.99 | +22.94 | ||||
| Conservative | Stephen Woodworth | 13,191 | 23.82 | -6.54 | ||||
| New Democratic | Andrew Moraga | 6,238 | 11.27 | -5.33 | ||||
| People's | Patrick Bernier | 1,033 | 1.87 | – | ||||
| Animal Protection | Ellen Papenburg | 202 | 0.36 | – | ||||
| Total valid votes/Expense limit | 55,374 | 99.17 | -0.27 | |||||
| Total rejected ballots | 465 | 0.83 | +0.27 | |||||
| Turnout | 55,839 | 67.13 | -1.33 | |||||
| Eligible voters | 83,177 | – | – | |||||
| Liberal hold | Swing | |||||||
| Source: Elections Canada[4][5] | ||||||||
| 2015 Canadian federal election | ||||||||
|---|---|---|---|---|---|---|---|---|
| Party | Candidate | Votes | % | ±% | Expenditures | |||
| Liberal | Raj Saini | 25,504 | 48.78 | +16.49 | $101,034.78 | |||
| Conservative | Stephen Woodworth | 15,872 | 30.36 | -10.00 | $127,440.14 | |||
| New Democratic | Susan Cadell | 8,680 | 16.60 | -5.32 | $56,988.49 | |||
| Green | Nicholas Wendler | 1,597 | 3.05 | -1.52 | $1,292.98 | |||
| Libertarian | Slavko Miladinovic | 515 | 0.99 | – | $9.05 | |||
| Marxist–Leninist | Julian Ichim | 112 | 0.21 | – | – | |||
| Total valid votes/Expense limit | 52,280 | 99.44 | $209,737.44 | |||||
| Total rejected ballots | 292 | 0.56 | – | |||||
| Turnout | 52,572 | 68.46 | ||||||
| Eligible voters | 76,797 | |||||||
| Liberal gain from Conservative | Swing | +13.25 | ||||||
| Source: Elections Canada[6][7] | ||||||||
| 2011 federal election redistributed results[8][9] | |||
|---|---|---|---|
| Party | Vote | % | |
| Conservative | 18,967 | 40.36 | |
| Liberal | 15,175 | 32.29 | |
| New Democratic | 10,305 | 21.93 | |
| Green | 2,152 | 4.58 | |
| Others | 396 | 0.84 | |
| 2011 Canadian federal election | ||||||||
|---|---|---|---|---|---|---|---|---|
| Party | Candidate | Votes | % | ±% | Expenditures | |||
| Conservative | Stephen Woodworth | 21,119 | 42.40 | +5.70 | $84,217.49 | |||
| Liberal | Karen Redman | 15,592 | 31.30 | -4.64 | $79,800.33 | |||
| New Democratic | Peter Thurley | 10,742 | 21.57 | +3.48 | $38,822.94 | |||
| Green | Byron Williston | 1,972 | 3.96 | -4.55 | $4,298.33 | |||
| Independent | Alan Rimmer | 199 | 0.40 | $1,916.45 | ||||
| Communist | Martin Suter | 93 | 0.19 | -0.10 | $502.09 | |||
| Marxist–Leninist | Mark Corbiere | 92 | 0.18 | – | none listed | |||
| Total valid votes/Expense limit | 49,809 | 99.58 | $87,274.51 | |||||
| Total rejected ballots | 209 | 0.42 | +0.01 | |||||
| Turnout | 50,018 | 63.15 | +5.12 | |||||
| Eligible voters | 80,480 | – | – | |||||
| Conservative hold | Swing | +5.17 | ||||||
| 2008 Canadian federal election | ||||||||
|---|---|---|---|---|---|---|---|---|
| Party | Candidate | Votes | % | ±% | Expenditures | |||
| Conservative | Stephen Woodworth | 16,480 | 36.69 | +4.56 | $75,291 | |||
| Liberal | Karen Redman | 16,141 | 35.94 | -7.32 | $74,745 | |||
| New Democratic | Oz Cole-Arnal | 8,152 | 18.08 | -0.35 | $26,622 | |||
| Green | John Bithell | 3,818 | 8.51 | +2.89 | $2,612 | |||
| Independent | Amanda Lamka | 215 | 0.47 | – | ||||
| Communist | Martin Suter | 127 | 0.28 | -0.26 | $373 | |||
| Total valid votes/Expense limit | 44,933 | 100.00 | $84,756 | |||||
| Total rejected ballots | 183 | 0.41 | -0.05 | |||||
| Turnout | 45,091 | 57.03 | -7.67 | |||||
| Conservative gain from Liberal | Swing | +5.94 | ||||||
| 2006 Canadian federal election | ||||||||
|---|---|---|---|---|---|---|---|---|
| Party | Candidate | Votes | % | ±% | ||||
| Liberal | Karen Redman | 21,715 | 43.26 | -3.8 | ||||
| Conservative | Steven Cage | 16,131 | 32.13 | +4.6 | ||||
| New Democratic | Richard Walsh-Bowers | 9,250 | 18.43 | -0.9 | ||||
| Green | Tony Maas | 2,822 | 5.62 | +0.2 | ||||
| Communist | Martin Suter | 274 | 0.54 | |||||
| Total valid votes | 50,192 | 100.00 | ||||||
| Total rejected ballots | 232 | 0.46 | ||||||
| Turnout | 50,426 | 64.70 | ||||||
| 2004 Canadian federal election | ||||||||
|---|---|---|---|---|---|---|---|---|
| Party | Candidate | Votes | % | ±% | ||||
| Liberal | Karen Redman | 21,264 | 47.1 | -5.7 | ||||
| Conservative | Thomas Ichim | 12,412 | 27.5 | -12.4 | ||||
| New Democratic | Richard Walsh-Bowers | 8,717 | 19.3 | +12.4 | ||||
| Green | Karol Vesely | 2,450 | 5.4 | |||||
| Independent | Mark Corbiere | 277 | 0.6 | |||||
| Total valid votes | 45,120 | 100.0 | ||||||
Note: Conservative vote is compared to the total of the Canadian Alliance vote and Progressive Conservative vote in 2000 election.
| 2000 Canadian federal election | ||||||||
|---|---|---|---|---|---|---|---|---|
| Party | Candidate | Votes | % | ±% | ||||
| Liberal | Karen Redman | 23,511 | 52.8 | +4.8 | ||||
| Alliance | Eloise Jantzi | 11,603 | 26.1 | +6.2 | ||||
| Progressive Conservative | Steven Daniel Gadbois | 6,162 | 13.8 | -8.9 | ||||
| New Democratic | Paul Royston | 3,058 | 6.9 | -2.5 | ||||
| Communist | Martin Suter | 167 | 0.4 | |||||
| Total valid votes | 44,501 | 100.0 | ||||||
Note: Canadian Alliance vote is compared to the Reform vote in 1997 election.
| 1997 Canadian federal election | ||||||||
|---|---|---|---|---|---|---|---|---|
| Party | Candidate | Votes | % | |||||
| Liberal | Karen Redman | 23,089 | 48.0 | |||||
| Progressive Conservative | John Reimer | 10,960 | 22.8 | |||||
| Reform | Ronald Albert Wilson | 9,550 | 19.9 | |||||
| New Democratic | Lucy Harrison | 4,503 | 9.4 | |||||
| Total valid votes | 48,102 | 100.0 | ||||||
See also
- List of Canadian federal electoral districts
- Past Canadian electoral districts
References
- "(Code 35037) Census Profile". 2011 census. Statistics Canada. 2012. Retrieved 2011-03-03.
- Federal riding history from the Library of Parliament
- 2001 Results from Elections Canada
- Campaign expense data from Elections Canada
Notes
- Statistics Canada: 2012
- Statistics Canada: 2012
- "List of confirmed candidates". Elections Canada. Retrieved 4 October 2019.
- "Election Night Results". Elections Canada. Retrieved 22 October 2019.
- Elections Canada – Confirmed candidates for Kitchener Centre, 30 September 2015
- Elections Canada – Preliminary Election Expenses Limits for Candidates Archived 2015-08-15 at the Wayback Machine
- Pundits' Guide to Canadian Elections
- Elections Canada Downloadable XLS
External links
- Kitchener Centre NDP Federal Electoral District Association
- Kitchener Centre Federal Liberal Electoral District Association
- Kitchener Centre Federal PPC Electoral District Association