Manchester Wythenshawe (UK Parliament constituency)
Manchester Wythenshawe was a parliamentary constituency centred on the Wythenshawe suburb of Manchester. It returned one Member of Parliament to the House of Commons of the Parliament of the United Kingdom.
| Manchester Wythenshawe | |
|---|---|
| Former Borough constituency for the House of Commons | |
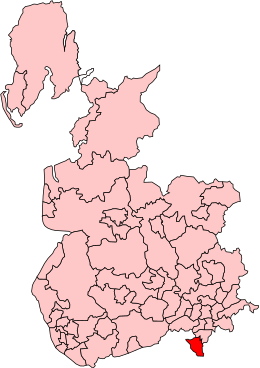
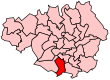 Manchester Wythenshawe in Greater Manchester, showing boundaries used from 1983-1997 | |
| County | Greater Manchester |
| 1950–1997 | |
| Number of members | One |
| Replaced by | Wythenshawe and Sale East, Cheadle, Altrincham and Sale West |
| Created from | Manchester Withington |
The constituency was created for the 1950 general election, and abolished for the 1997 general election. It was then largely replaced by the new Wythenshawe and Sale East constituency.
Boundaries
1950–1955: The County Borough of Manchester wards of Didsbury and Wythenshawe.
1955–1974: The County Borough of Manchester wards of Baguley, Benchill, Didsbury, Northenden, and Woodhouse Park.
1974–1983: The County Borough of Manchester wards of Baguley, Benchill, Northenden, and Woodhouse Park.
1983–1997: The City of Manchester wards of Baguley, Benchill, Brooklands, Northenden, Sharston, and Woodhouse Park.
Members of Parliament
| Election | Member[1] | Party | |
|---|---|---|---|
| 1950 | Eveline Hill | Conservative | |
| 1964 | Alf Morris | Labour | |
| 1997 | constituency abolished: see Wythenshawe and Sale East, Cheadle & Altrincham and Sale West | ||
Elections
Elections in the 1950s
| Party | Candidate | Votes | % | ± | |
|---|---|---|---|---|---|
| Conservative | Eveline Hill | 22,775 | 49.3 | ||
| Labour | Charles W Bridges | 17,191 | 37.2 | ||
| Liberal | Eric Noble | 5,607 | 12.2 | ||
| Communist | Frances Dean[3] | 588 | 1.3 | ||
| Majority | 5,584 | 12.1 | |||
| Turnout | 84.2 | ||||
| Conservative hold | Swing | ||||
| Party | Candidate | Votes | % | ± | |
|---|---|---|---|---|---|
| Conservative | Eveline Hill | 28,611 | 56.5 | ||
| Labour | Lewis L Hanbidge | 22,055 | 43.5 | ||
| Majority | 6,556 | 12.9 | |||
| Turnout | 81.1 | ||||
| Conservative hold | Swing | ||||
| Party | Candidate | Votes | % | ± | |
|---|---|---|---|---|---|
| Conservative | Eveline Hill | 26,200 | 52.8 | ||
| Labour | Norman Atkinson | 23,378 | 47.2 | ||
| Majority | 2,882 | 5.7 | |||
| Turnout | 76.3 | ||||
| Conservative hold | Swing | ||||
| Party | Candidate | Votes | % | ± | |
|---|---|---|---|---|---|
| Conservative | Eveline Hill | 28,934 | 51.2 | ||
| Labour Co-op | Alf Morris | 27,625 | 48.9 | ||
| Majority | 1,309 | 2.3 | |||
| Turnout | 80.9 | ||||
| Conservative hold | Swing | ||||
Elections in the 1960s
| Party | Candidate | Votes | % | ± | |
|---|---|---|---|---|---|
| Labour Co-op | Alf Morris | 26,870 | 47.7 | ||
| Conservative | Eveline Hill | 22,093 | 39.2 | ||
| Liberal | Thomas N Armstrong | 7,336 | 13.0 | ||
| Majority | 4,777 | 8.5 | |||
| Turnout | 79.6 | ||||
| Labour Co-op gain from Conservative | Swing | ||||
| Party | Candidate | Votes | % | ± | |
|---|---|---|---|---|---|
| Labour Co-op | Alf Morris | 27,485 | 53.1 | ||
| Conservative | Frank Lofthouse | 18,548 | 35.8 | ||
| Liberal | Thomas N Armstrong | 5,717 | 11.1 | ||
| Majority | 8,937 | 17.3 | |||
| Turnout | 74.8 | ||||
| Labour Co-op hold | Swing | ||||
Elections in the 1970s
| Party | Candidate | Votes | % | ± | |
|---|---|---|---|---|---|
| Labour Co-op | Alf Morris | 30,260 | 55.3 | ||
| Conservative | Henry Donald Moore | 24,505 | 44.8 | ||
| Majority | 5,755 | 10.5 | |||
| Turnout | 54,765 | 70.2 | |||
| Labour Co-op hold | Swing | ||||
| Party | Candidate | Votes | % | ± | |
|---|---|---|---|---|---|
| Labour Co-op | Alf Morris | 26,900 | 55.7 | ||
| Conservative | Joyce Hill | 14,462 | 30.0 | ||
| Liberal | Anthony Blonde | 6,905 | 14.3 | ||
| Majority | 12,438 | 25.8 | |||
| Turnout | 75.0 | ||||
| Labour Co-op hold | Swing | ||||
| Party | Candidate | Votes | % | ± | |
|---|---|---|---|---|---|
| Labour Co-op | Alf Morris | 26,448 | 59.1 | ||
| Conservative | Joyce Hill | 12,269 | 27.4 | ||
| Liberal | RN Scott | 6,071 | 13.6 | ||
| Majority | 14,179 | 31.7 | |||
| Turnout | 68.8 | ||||
| Labour Co-op hold | Swing | ||||
| Party | Candidate | Votes | % | ± | |
|---|---|---|---|---|---|
| Labour Co-op | Alf Morris | 26,860 | 59.1 | ||
| Conservative | David Sumberg | 14,747 | 32.4 | ||
| Liberal | Lee Griffiths | 3,853 | 8.5 | ||
| Majority | 12,113 | 26.7 | |||
| Turnout | 75.0 | ||||
| Labour Co-op hold | Swing | ||||
Elections in the 1980s
| Party | Candidate | Votes | % | ± | |
|---|---|---|---|---|---|
| Labour Co-op | Alf Morris | 23,172 | 54.6 | ||
| Conservative | Joan Jacobs | 12,488 | 29.4 | ||
| Liberal | David J. Sandiford | 6,766 | 16 | ||
| Majority | 10,684 | 25.2 | |||
| Turnout | 69.6 | ||||
| Labour Co-op hold | Swing | ||||
| Party | Candidate | Votes | % | ± | |
|---|---|---|---|---|---|
| Labour Co-op | Alf Morris | 23,881 | 56.8 | ||
| Conservative | David Sparrow | 12,026 | 28.6 | ||
| SDP | Joan Butterworth | 5,921 | 14.1 | ||
| Red Front | Susan Connelly | 216 | 0.5 | ||
| Majority | 11,855 | 28.2 | |||
| Turnout | 72.1 | ||||
| Labour Co-op hold | Swing | ||||
Elections in the 1990s
| Party | Candidate | Votes | % | ± | |
|---|---|---|---|---|---|
| Labour Co-op | Alf Morris | 22,591 | 60.5 | +3.7 | |
| Conservative | Kevin A. McKenna | 10,595 | 28.4 | −0.2 | |
| Liberal Democrats | Stephen Fenn | 3,633 | 9.7 | −4.3 | |
| Green | Guy N. Otten | 362 | 1.0 | N/A | |
| Natural Law | Elspeth Martin | 133 | 0.4 | N/A | |
| Majority | 11,996 | 32.1 | +4.0 | ||
| Turnout | 37,314 | 69.7 | −2.5 | ||
| Labour Co-op hold | Swing | +2.0 | |||
References
- Leigh Rayment's Historical List of MPs – Constituencies beginning with "W" (part 5)
- "UK General Election results 1950". Richard Kimber's Political Science Resources. Politics Resources. Archived from the original on 24 September 2015. Retrieved 1 January 2014.
- Stevenson, Graham. "Dean Frances". Retrieved 29 April 2017.
- "UK General Election results 1951". Richard Kimber's Political Science Resources. Politics Resources. Archived from the original on 24 September 2015. Retrieved 1 January 2014.
- "UK General Election results 1955". Richard Kimber's Political Science Resources. Politics Resources. Archived from the original on 24 September 2015. Retrieved 1 January 2014.
- "UK General Election results 1950". Richard Kimber's Political Science Resources. Politics Resources. Archived from the original on 2 January 2014. Retrieved 1 January 2014.
- "UK General Election results 1964". Richard Kimber's Political Science Resources. Politics Resources. Archived from the original on 16 June 2015. Retrieved 1 January 2014.
- "UK General Election results 1966". Richard Kimber's Political Science Resources. Politics Resources. Archived from the original on 16 June 2015. Retrieved 1 January 2014.
- "UK General Election results 1970". Richard Kimber's Political Science Resources. Politics Resources. Archived from the original on 16 June 2015. Retrieved 1 January 2014.
- "UK General Election results February 1974". Richard Kimber's Political Science Resources. Politics Resources. Archived from the original on 27 January 2015. Retrieved 1 January 2014.
- "UK General Election results Oct 1974". Richard Kimber's Political Science Resources. Politics Resources. Archived from the original on 8 May 2015. Retrieved 1 January 2014.
- "UK General Election results 1979". Richard Kimber's Political Science Resources. Politics Resources. Archived from the original on 5 March 2012. Retrieved 1 January 2014.
- "UK General Election results 1983". Richard Kimber's Political Science Resources. Politics Resources. Archived from the original on 24 September 2015. Retrieved 1 January 2014.
- "UK General Election results 1987". Richard Kimber's Political Science Resources. Politics Resources. Archived from the original on 24 September 2015. Retrieved 1 January 2014.
- "UK General Election results April 1992". Richard Kimber's Political Science Resources. Politics Resources. 9 April 1992. Archived from the original on 4 March 2016. Retrieved 6 December 2010.